by Chris Kimble | Oct 2, 2020 | Kimble Charting
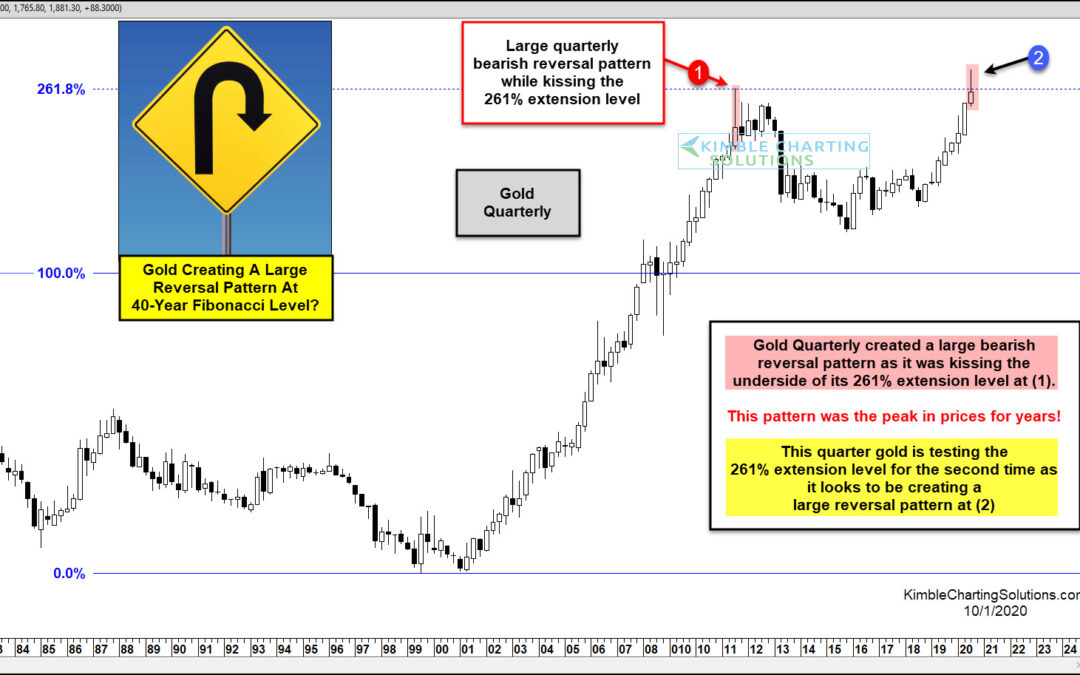
Precious metals multi-month rally continued into September, with Gold hitting new all-time highs. But Gold may be sending a cautious message to bulls at the end of September month and quarters-end. While the trend is very much bullish, Gold has created a large bearish...
by Chris Kimble | Sep 30, 2020 | Kimble Charting
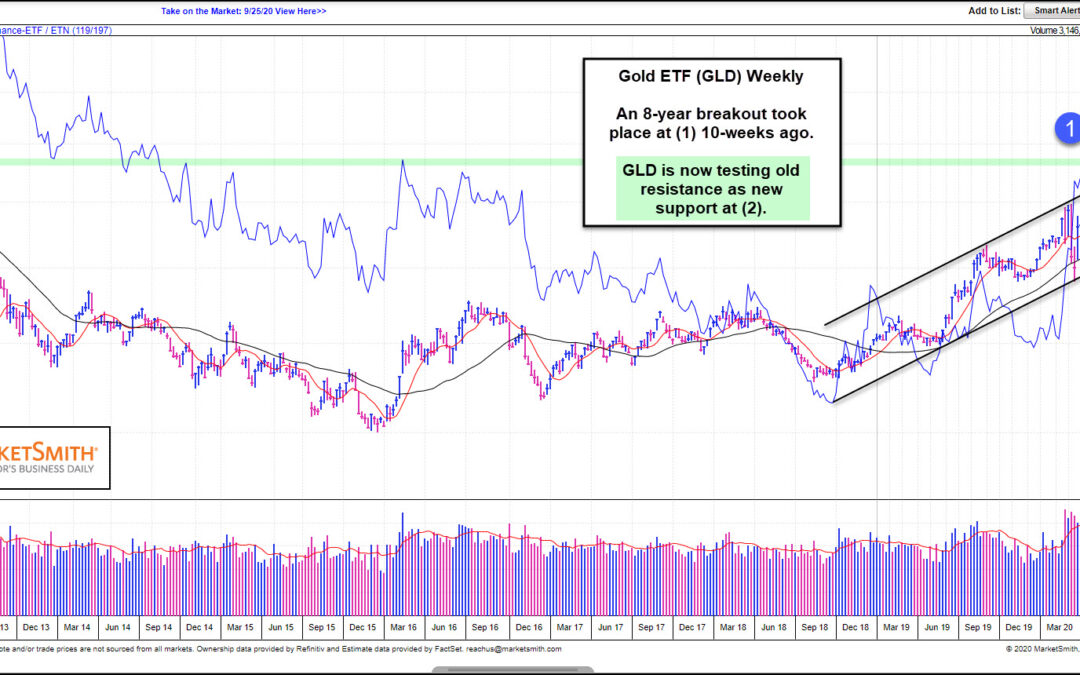
It’s been a heck of a year for Gold. But the year isn’t over yet and precious metals investors are hoping it will close the year out strong. That may depend on what happens in the coming days/weeks. In today’s article, we feature a “weekly” chart of the Gold...
by Chris Kimble | Sep 17, 2020 | Kimble Charting
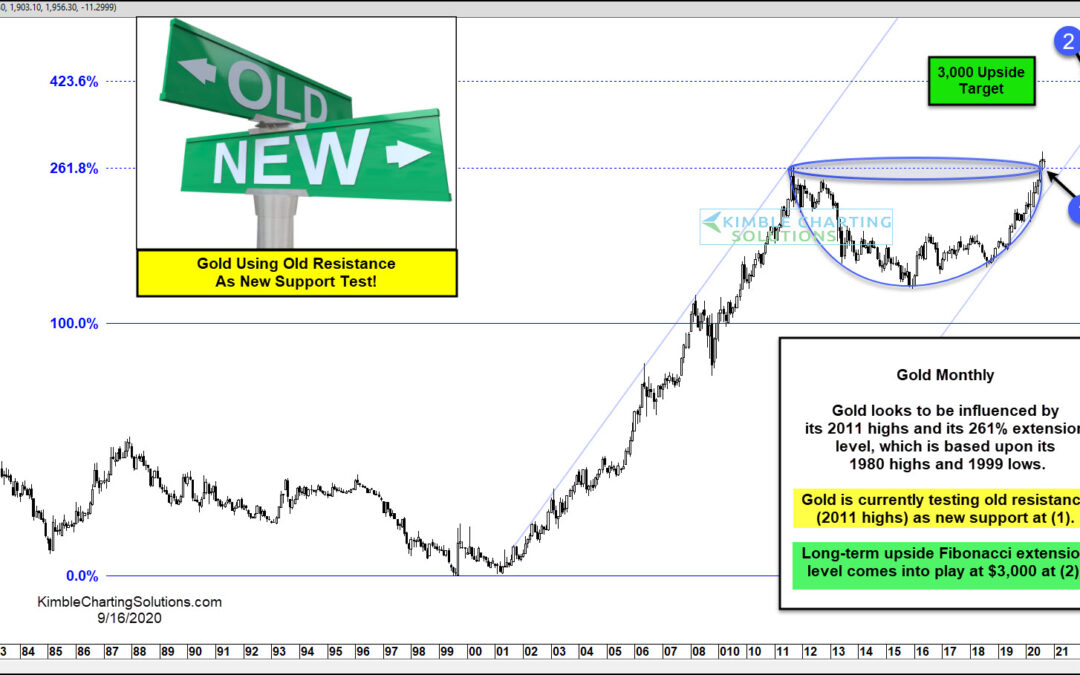
90-days ago this cup & handle pattern was discussed on See It Market when Gold was trading at 1717. Fast-forward to today and Gold is up 15 percent. So it’s time for an update! As we pointed out 90-days ago, the initial price magnet for the rally was the 261.8...
by Chris Kimble | Aug 12, 2020 | Kimble Charting
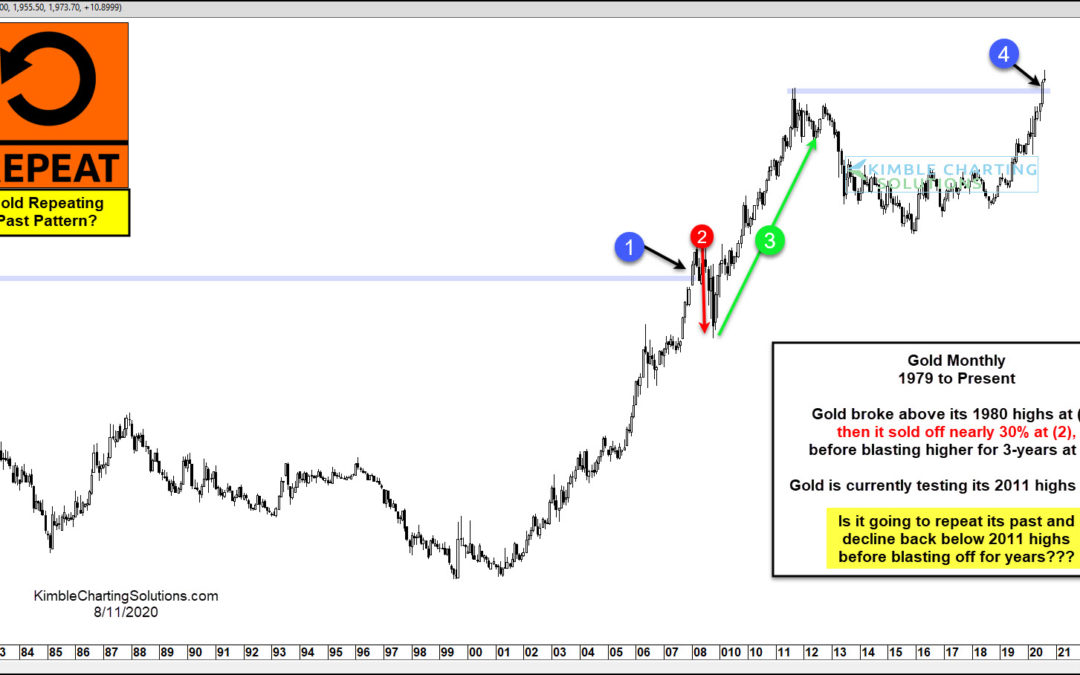
Over a decade ago, Gold rallied past its 1980 highs and over $1000/oz at (1) on today’s chart. That rise to new highs was met with a 30 percent correction at (2), followed by a blast off rally to new highs. Is gold setting up for a repeat of its past? Gold recently...
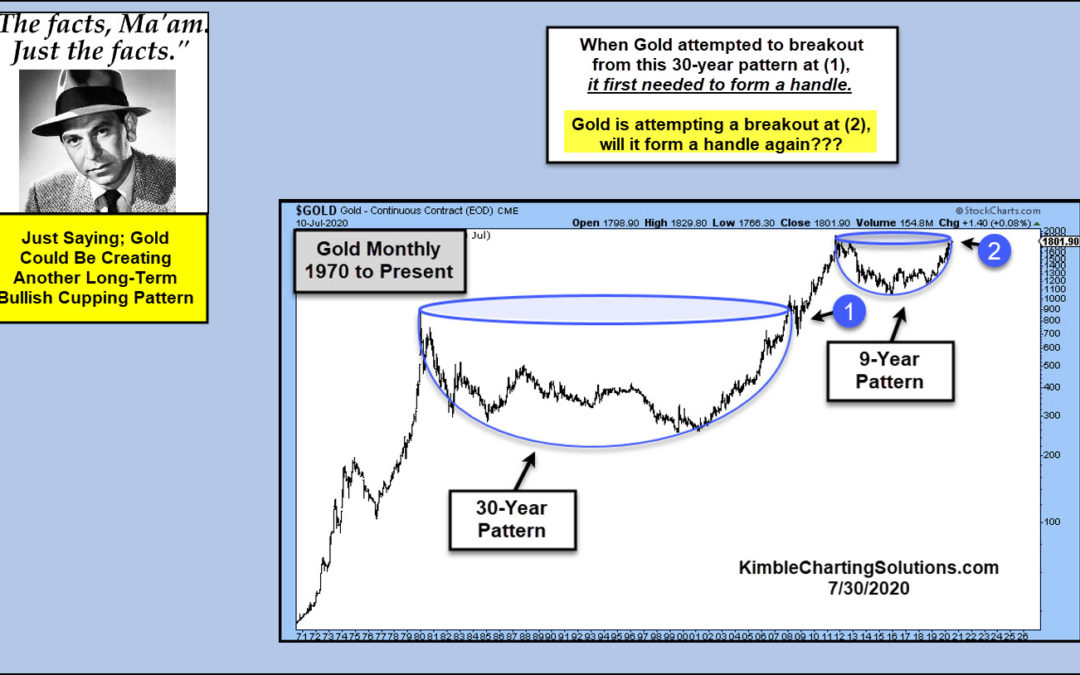
by Chris Kimble | Jul 31, 2020 | Kimble Charting
Is Gold forming another long-term bullish cupping pattern? Sure could be! Is the long-term pattern complete? If history is a guide, it would suggest not yet. When gold attempted to break above its 1980 highs, it first needed to form a “handle.” It did so...
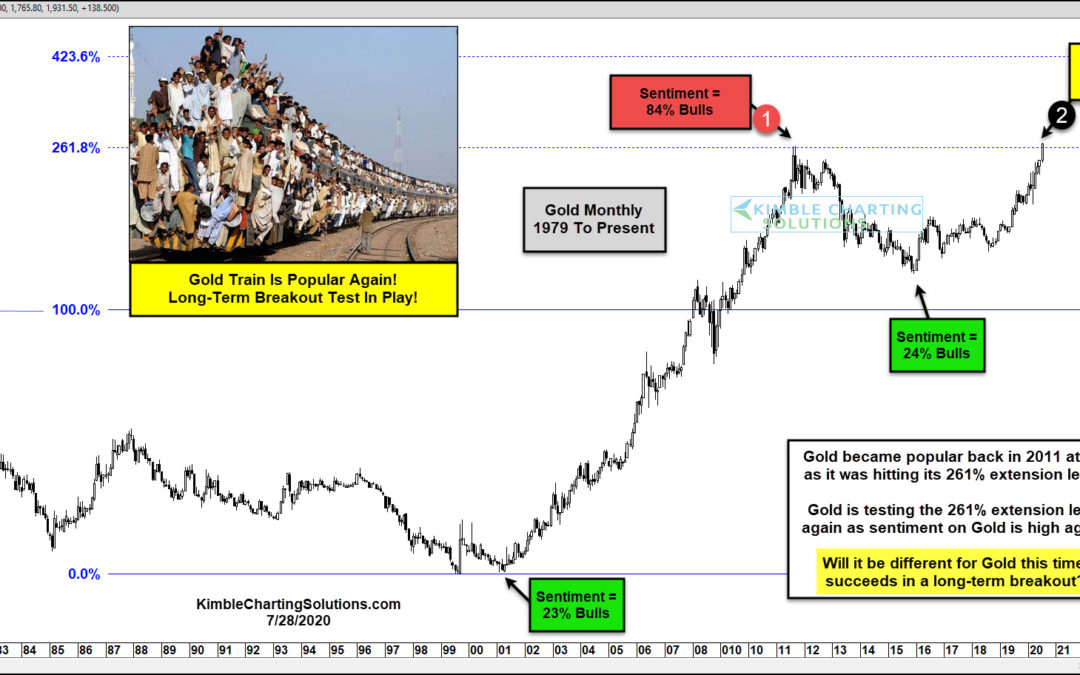
by Chris Kimble | Jul 28, 2020 | Kimble Charting
When sentiment reaches extremes, markets are often near important long-term inflection points. Is the current extreme in Gold sentiment suggesting that an important inflection point is in play? This chart looks at Gold on a monthly basis over the past 40-years, with...
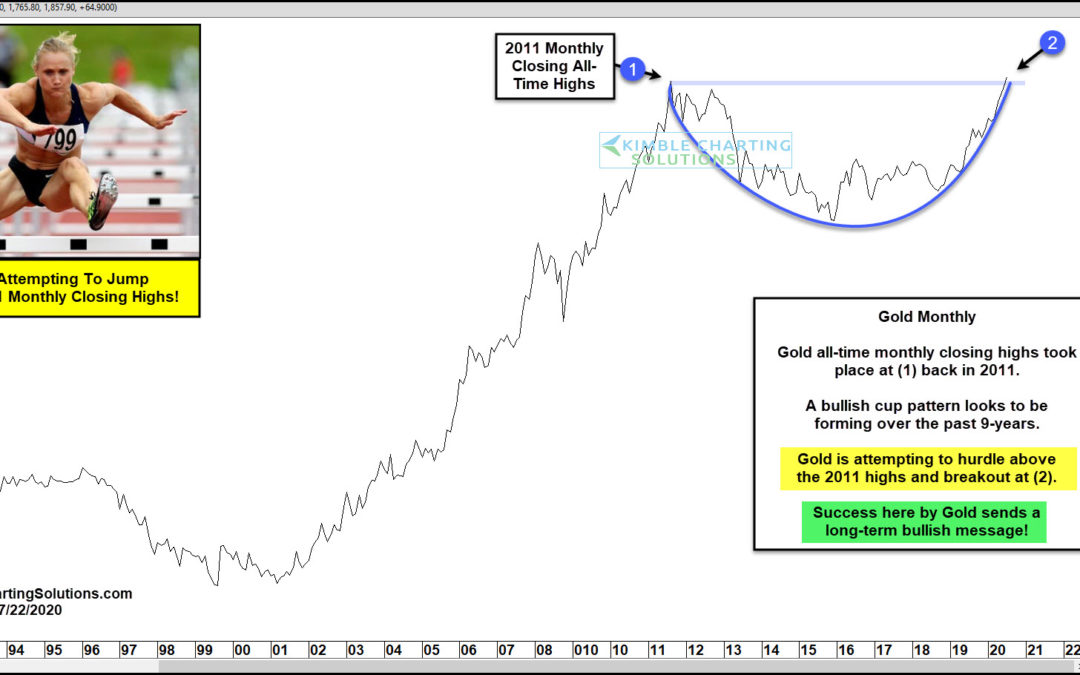
by Chris Kimble | Jul 22, 2020 | Kimble Charting
Is Gold about to hurdle above 2011 monthly closing highs and send a long-awaited bullish message? It is attempting to do so at this time! This chart looks at Gold on a monthly closing basis. The 2011 monthly closing highs took place at (1). Gold looks to be forming a...
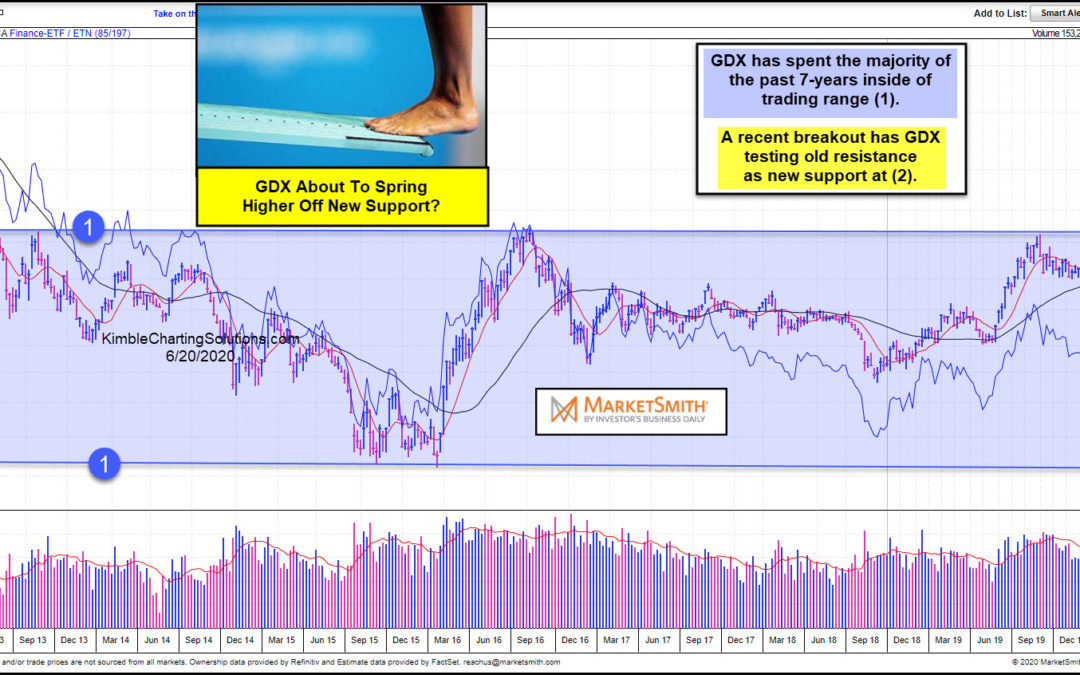
by Chris Kimble | Jun 22, 2020 | Kimble Charting
For the first time in years, Gold Miners ETF (GDX) is attempting to use old resistance as a price point to spring higher off of! This chart from Marketsmith.com reflects that GDX has remained inside of trading channel (1) for the past 7-years. Recently it broke above...
