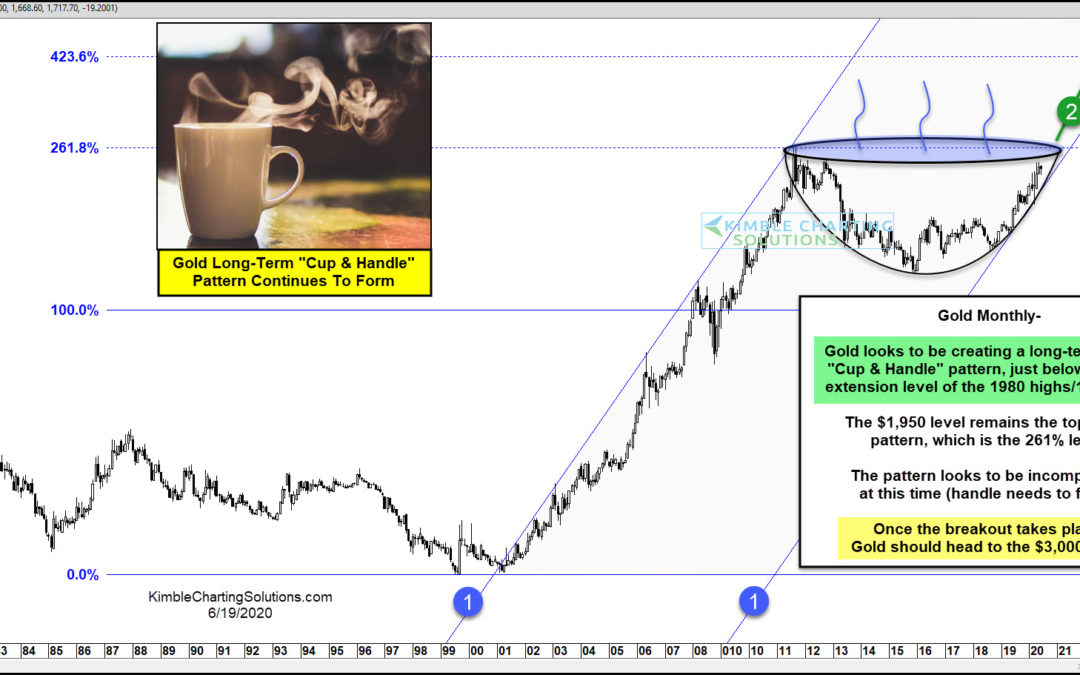
by Chris Kimble | Jun 19, 2020 | Kimble Charting
The slow and steady rise in gold prices over the past 4 years has created seen Gold recover a majority of its losses post 2011 highs. It’s also helped to form a potentially bullish price pattern: the Cup and Handle pattern. This spring I showed how the “cup” was in...
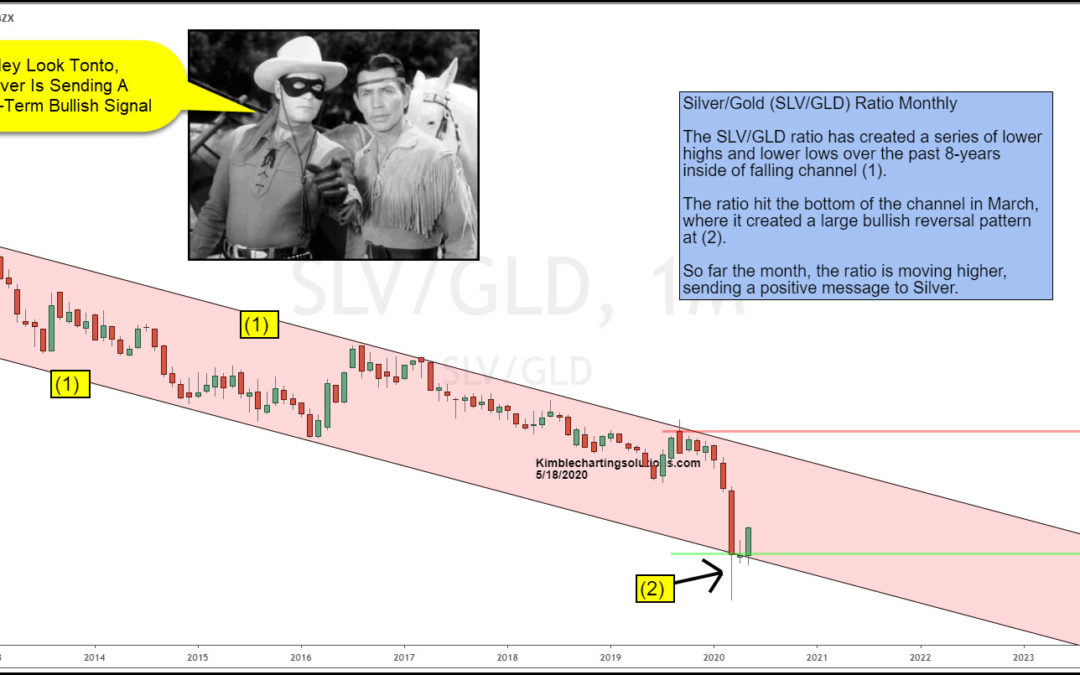
by Chris Kimble | May 18, 2020 | Kimble Charting
Silver has been much weaker than Gold over the past 8-years! Is that trend about to change? Possible! This chart looks at the Silver ETF & Gold ETF (SLV/GLD) ratio on a monthly basis over the past 8-years. No doubt the trend for the ratio is lower, as it has...
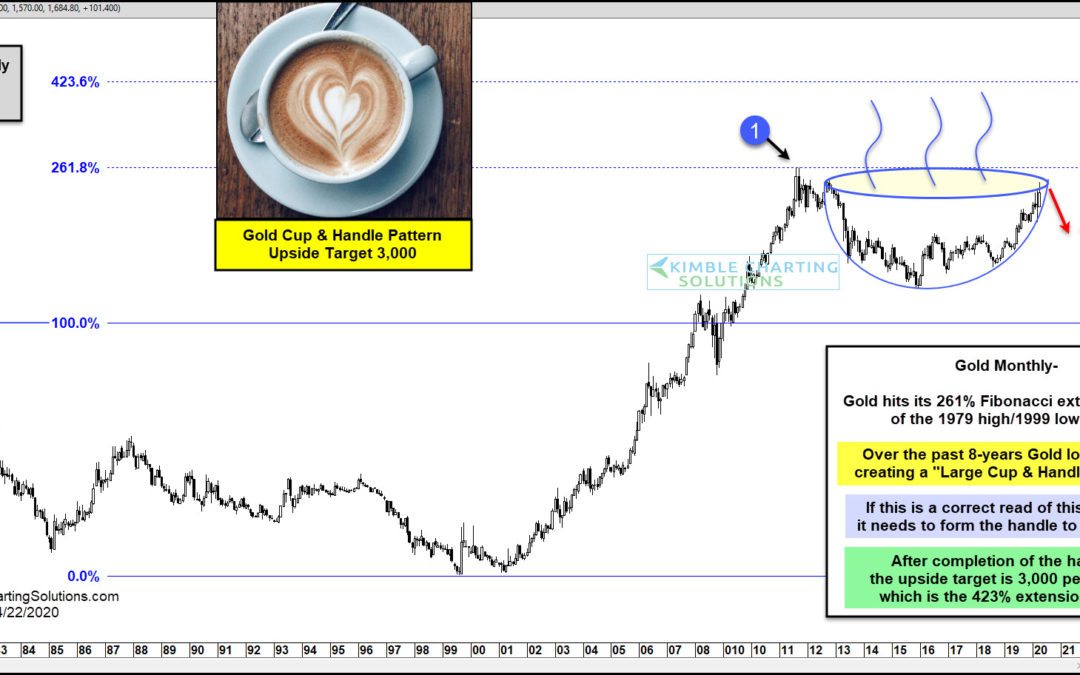
by Chris Kimble | Apr 22, 2020 | Kimble Charting
In 2011, Gold bugs were gushing with bullish sentiment as Gold prices rallied sharply before peaking around $1900. That peak formed at the 261.8 percent Fibonacci extension of the 1979 high / 1999 low at (1) on today’s chart. The next 8 years saw Gold prices enter a...
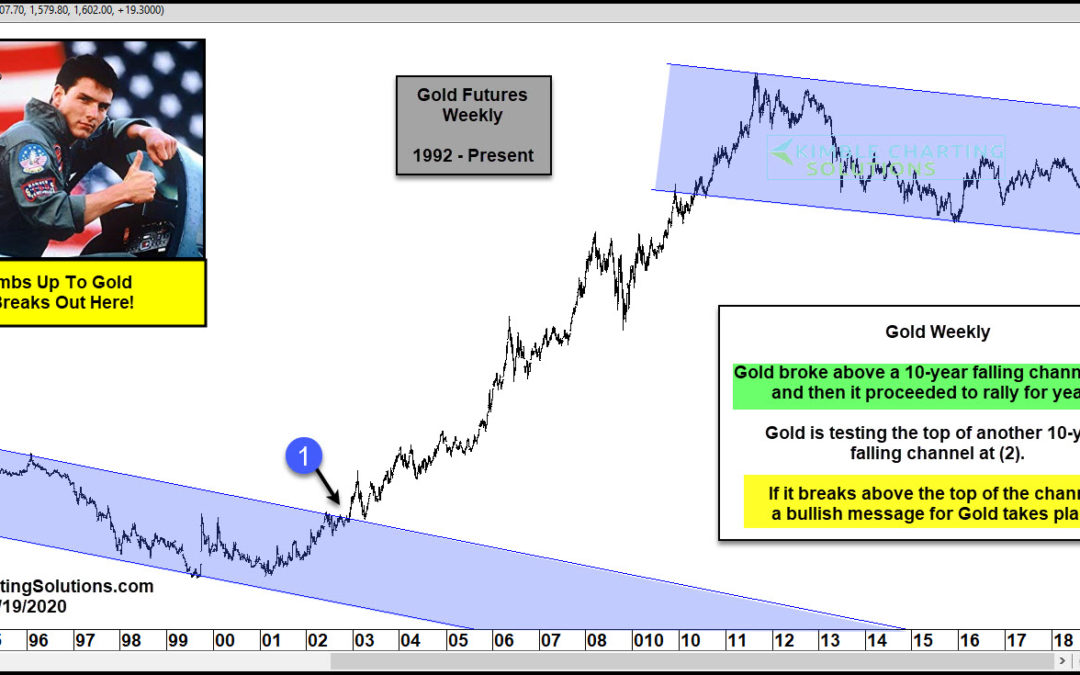
by Chris Kimble | Feb 19, 2020 | Kimble Charting
Gold created a series of lower highs and lower lows for nearly a decade (Early 1990’s to early 2000’s). This price action created a 10-year falling channel. Once Gold broke above this falling channel at (1), it experienced a strong rally for years to come....
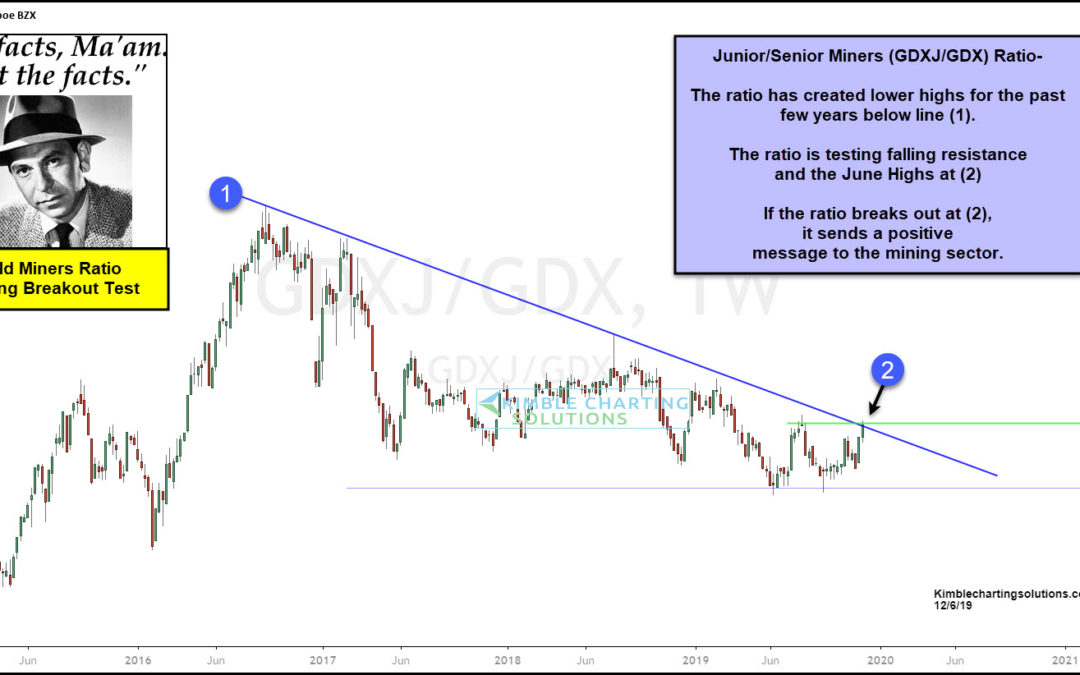
by Chris Kimble | Dec 6, 2019 | Kimble Charting
Are Gold Mining stocks about to be sent a bullish signal they haven’t received in years? Possible says Joe Friday. This chart looks at the Senior Miner/Junior miner (GDXJ/GDX) ratio over the past few years. Historically when the ratio is heading up, miners tend...
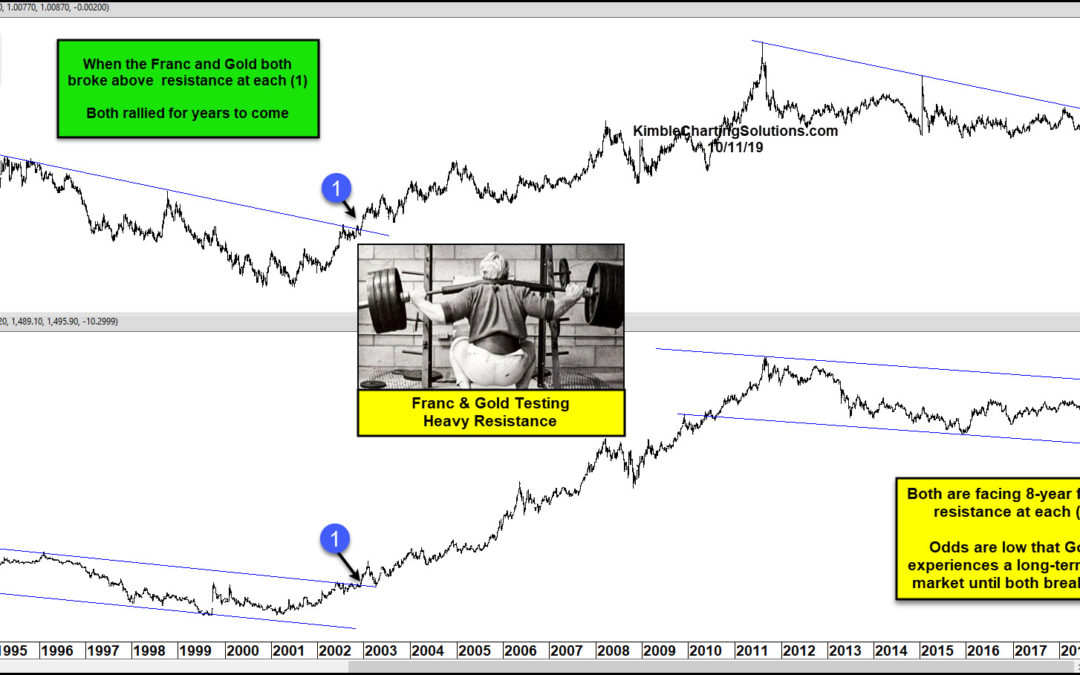
by Chris Kimble | Oct 12, 2019 | Kimble Charting
After a big summer rally, Gold peaked out at $1566/oz in September. Since then, Gold prices have been consolidating between $1475 and $1550. So what’s happening here? Enter the Swiss Franc currency… In today’s chart, we look at a key indicator (and correlation) for...
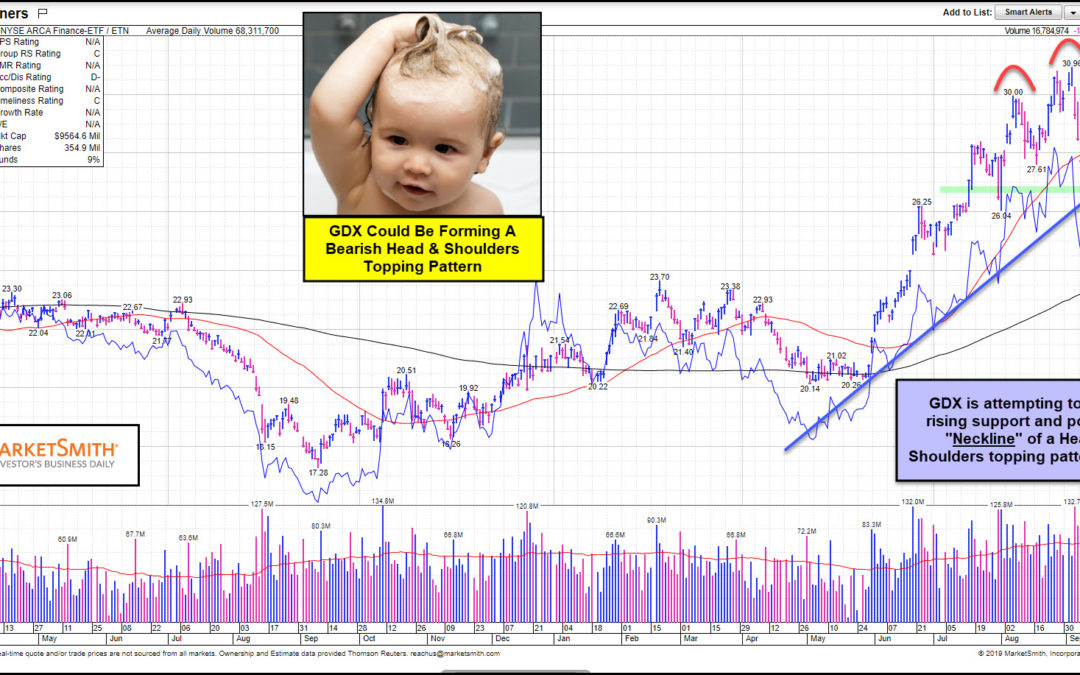
by Chris Kimble | Sep 30, 2019 | Kimble Charting
This chart of Senior Gold Miners (GDX) from Marketsmith.com reflects it could be forming a “Head & Shoulders” topping pattern over the past couple of months. This pattern could be about to send Gold Miners a rather bearish message. What would it take...
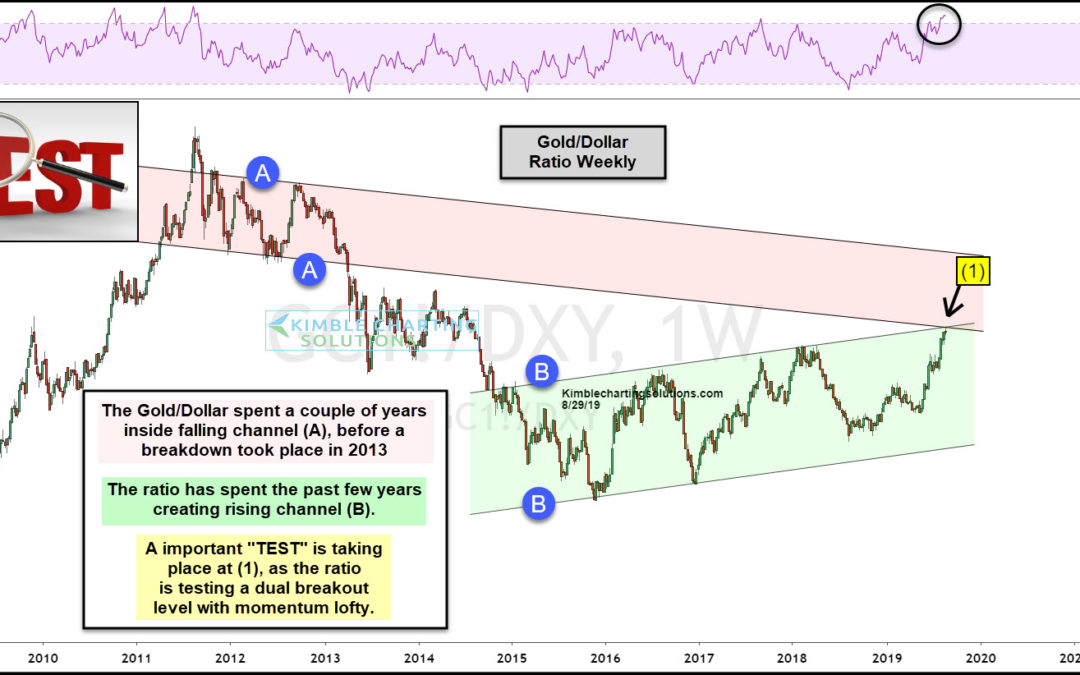
by Chris Kimble | Aug 29, 2019 | Kimble Charting
Gold/Metals bulls want to pay attention to how this indicator handles a current breakout test! This chart looks at the Gold/Dollar ratio on a weekly basis over the past decade. The ratio created a falling channel (A) from 2011 to 2013. Once support broke Gold...
