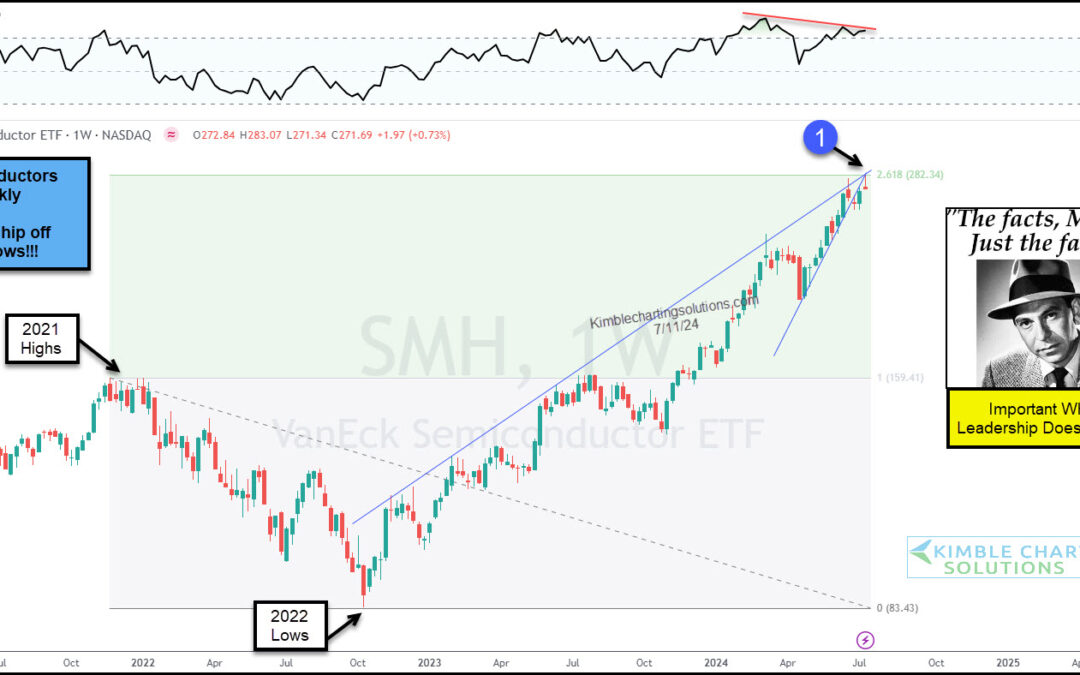
by Chris Kimble | Jul 15, 2024 | Kimble Charting
Technology stocks have been a bona fide leader, repelling sell off attempts and pushing higher. Same goes for the undisputed king of technology, the Semiconductors Sector (SMH). BUT, we are at a critical crossroads for SMH (and the broader market!). “The facts, Ma’am....
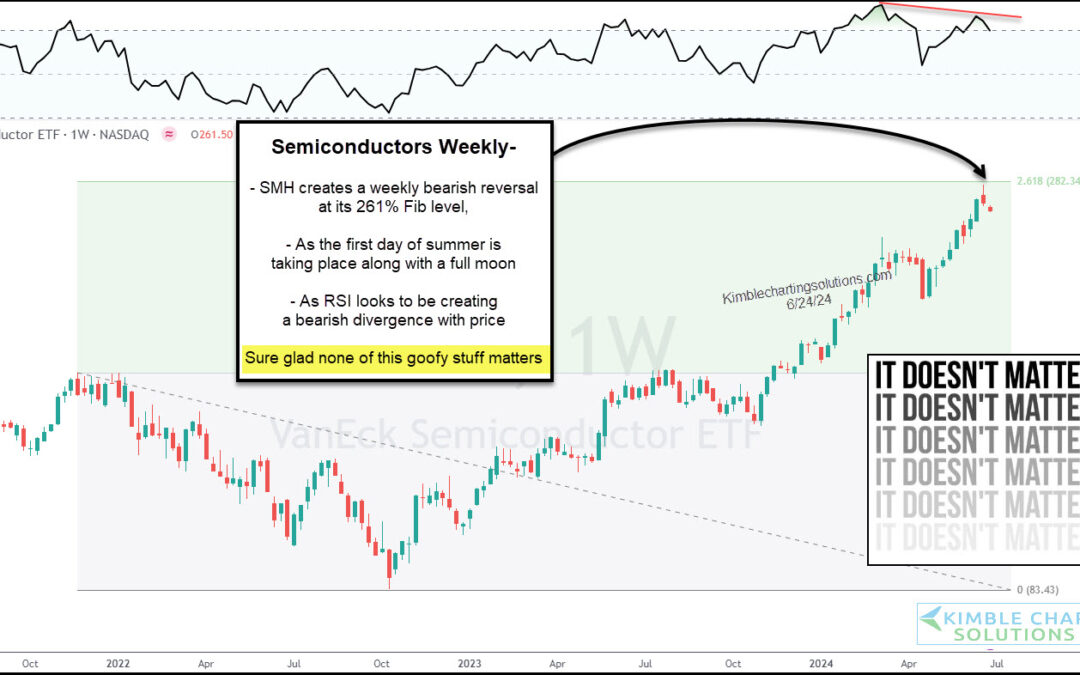
by Chris Kimble | Jun 25, 2024 | Kimble Charting
The stock market has been on an incredible run. As we have pointed out several times, the bull market’s run higher has been led by technology stocks, more precisely, semiconductor stocks. So, with the stock market indices taking a pause, it makes sense to...
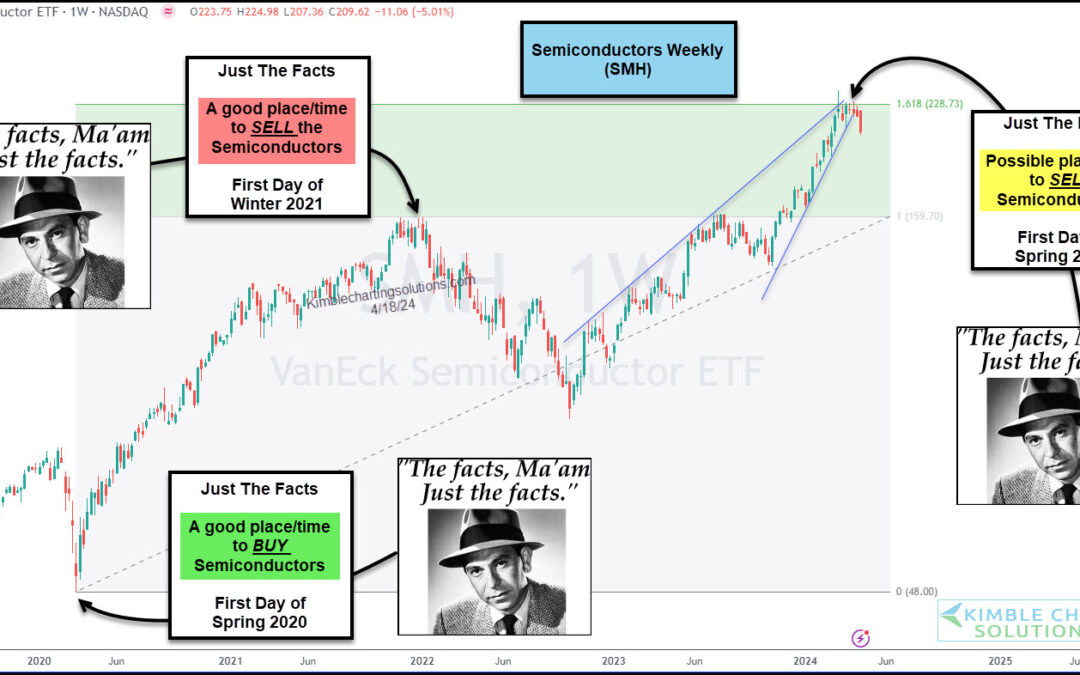
by Chris Kimble | Apr 19, 2024 | Kimble Charting
We often talk about leadership. Stocks that are leading the market higher. Sectors that are leading the market higher. Indices that are leading the market higher. Why? Because it pays to be invested in leadership when the market is on the way up. And one can avoid...
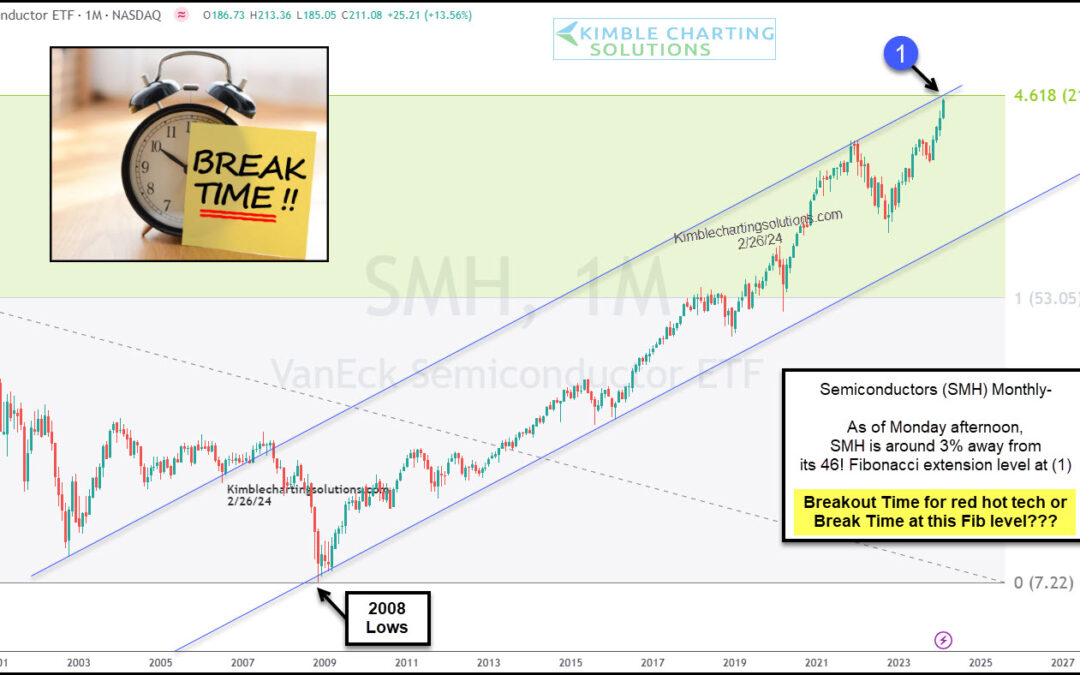
by Chris Kimble | Feb 27, 2024 | Kimble Charting
Investors have been treated to one heck of a rally by the Semiconductor Sector (SMH) with stocks like Nvidia (NVDA) leading the sector and stock market higher. But the semiconductor sector may be nearing a crossroads. Is it breakout time or break time for the red-hot...
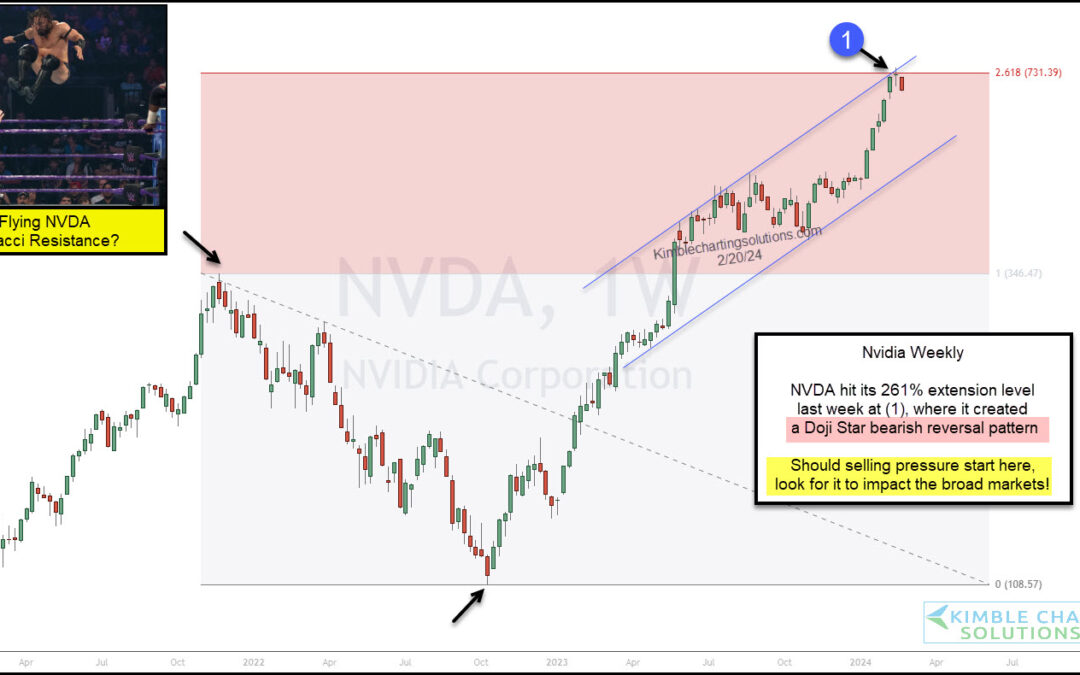
by Chris Kimble | Feb 21, 2024 | Kimble Charting
Nvidia has captured the technology investor community by storm. Nvidia’s stock price (ticker: NVDA) has surged in recent weeks and this has lead the broader stock market higher! But, as you can see on today’s “weekly” chart of Nvidia, the high flying NVDA hit its 261%...
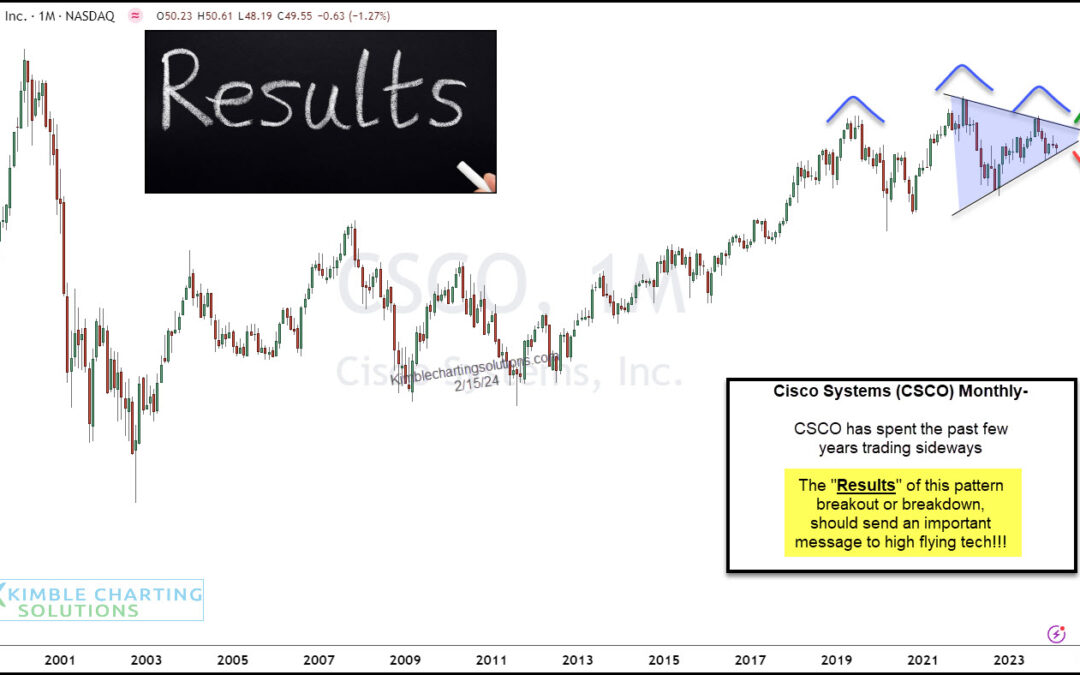
by Chris Kimble | Feb 16, 2024 | Kimble Charting
Cisco (CSCO) used to be one of the four horsemen of the Nasdaq (tech stocks) rally. While CSCO still has plenty of influence as a large-cap leader in the Semiconductor Sector, it is under-performing its peers and trading in a pennant pattern. In short, Cisco has...
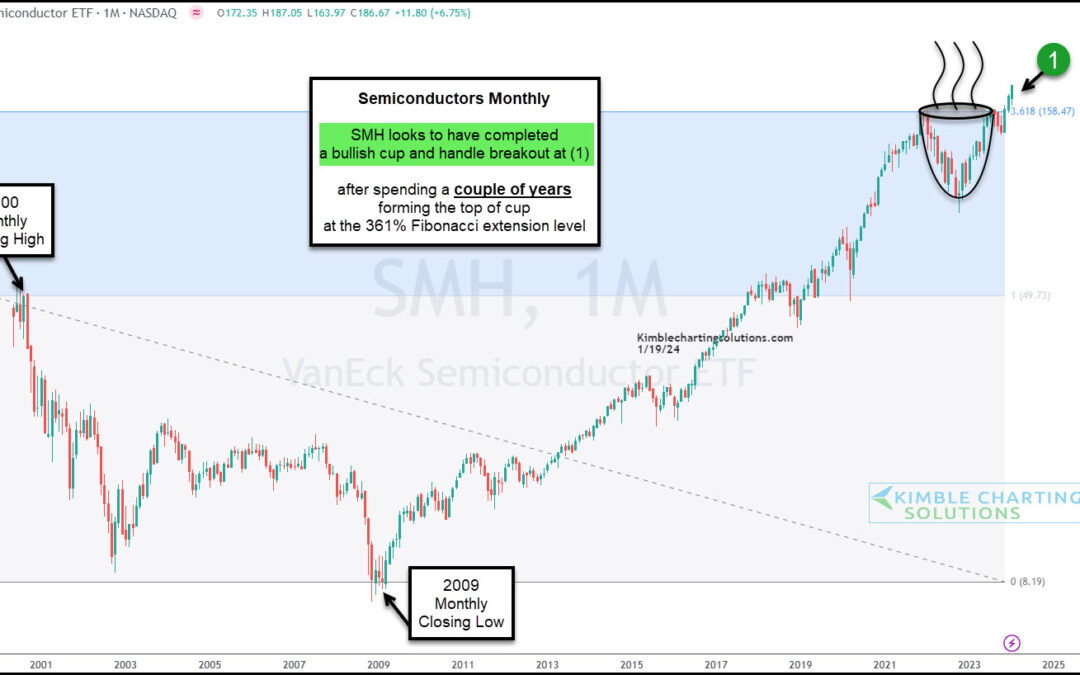
by Chris Kimble | Jan 24, 2024 | Kimble Charting
Not too long ago, we wrote about a potential cup with handle breakout for the market-leading Semiconductors ETF (SMH). You can read that here. Today, we examine a “monthly” chart of $SMH to provide an update on that powerful price pattern. As you can see, a breakout...
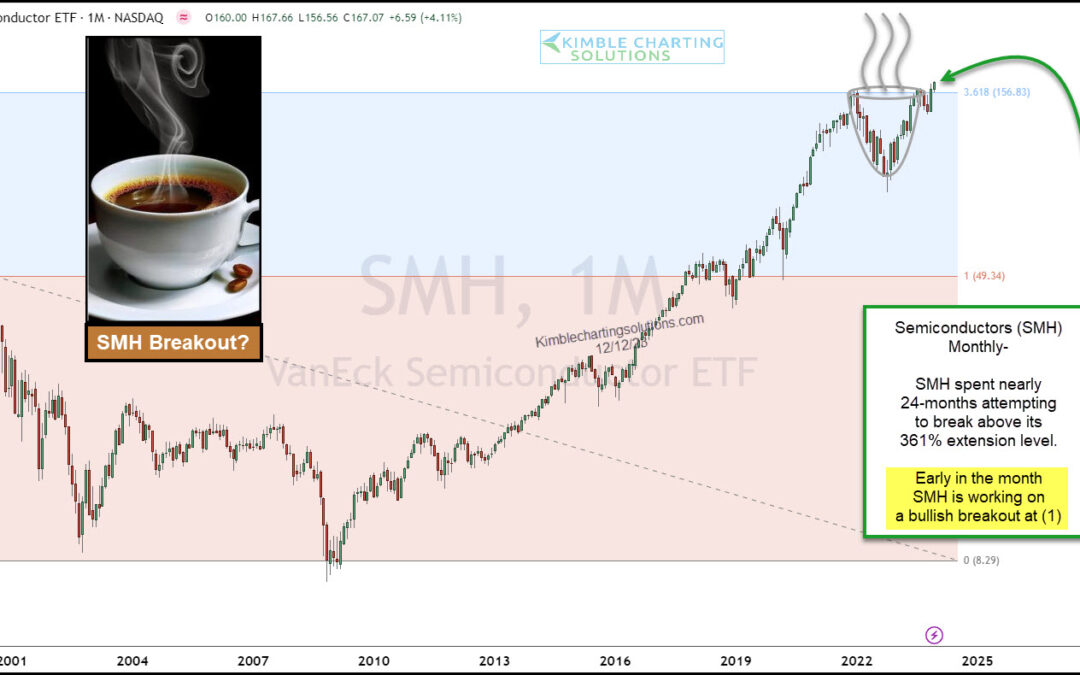
by Chris Kimble | Dec 14, 2023 | Kimble Charting
As I often point out, technology stocks have been the leader of bull market since 2009. And it’s always a good idea to keep a good eye on leadership. Within the technology sector, the Semiconductors are an area that is often out-performing. Today, we highlight why...
