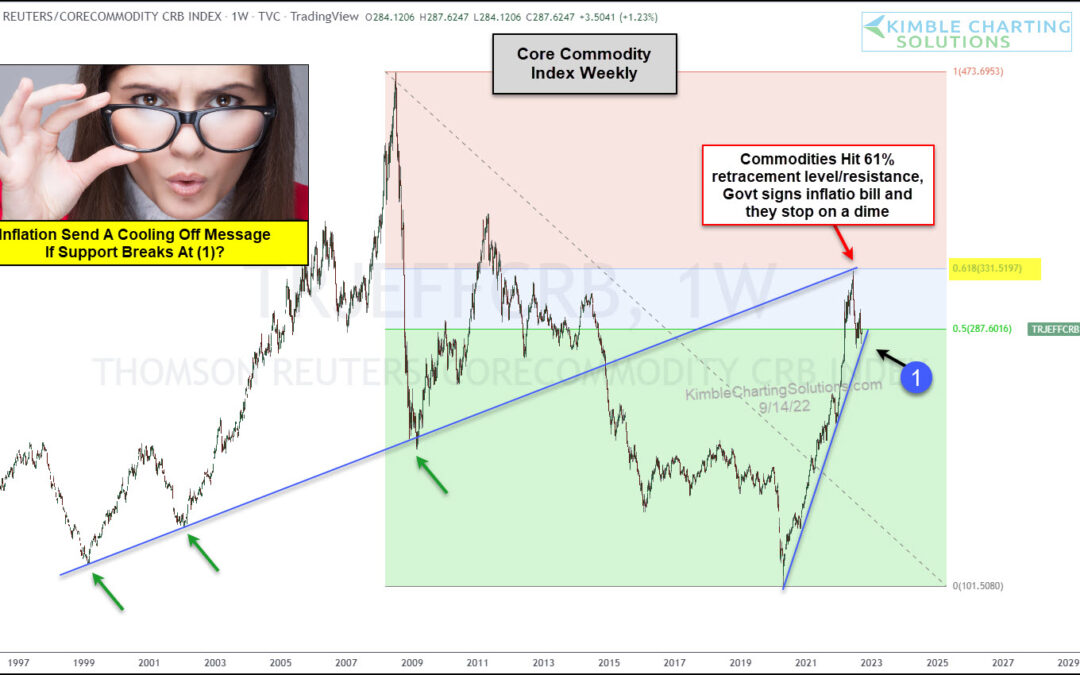
by Chris Kimble | Sep 15, 2022 | Kimble Charting
Rising prices have hit consumers hard and disrupted balance sheets in corporate America. Even more interesting is that we have inflation while the US Dollar is strengthening! Crazy times. In any event, two of the biggest inputs are energy (gas) and agriculture (food)....
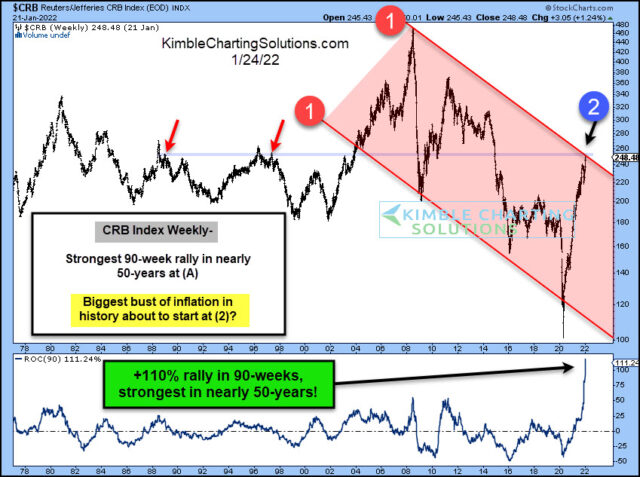
by Chris Kimble | Jan 27, 2022 | Kimble Charting
Commodities were already in a slump when coronavirus hit in 2020. That crash sent commodities to the lowest levels in decades. A quick economic rebound led to a return of demand which in turn led to shortages in 2021 and into 2022. So now what? Well, if you look at...
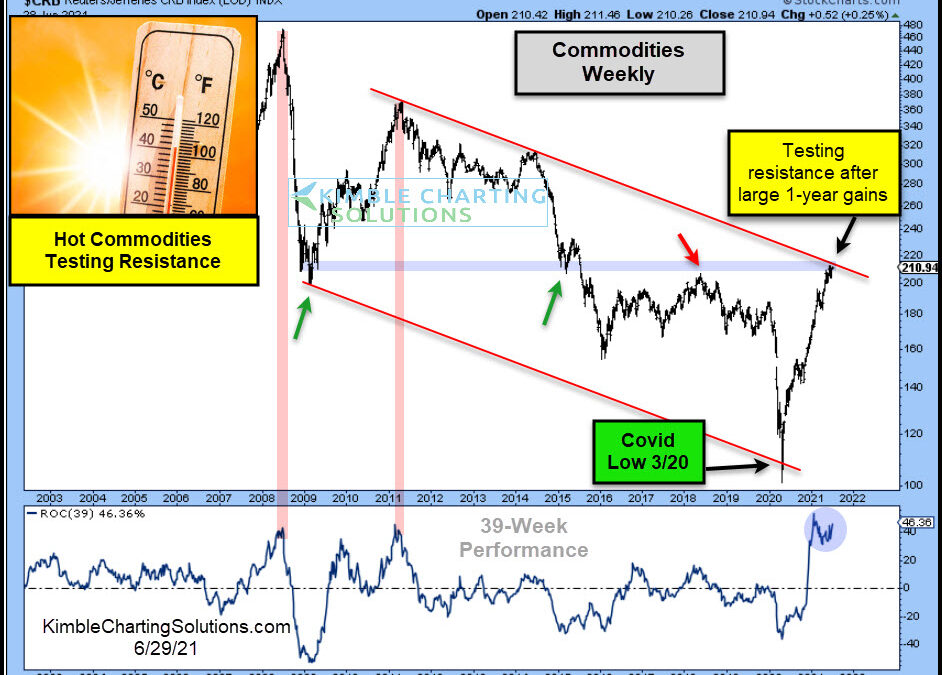
by Chris Kimble | Jun 30, 2021 | Kimble Charting
Rewind to March 2020 and things weren’t looking so good for commodities. COVID-19 was in the news and several assets were trading sharply lower. Then came the comeback. And in a big way. Perhaps even concerning way when you fast forward to today. As you can see in...
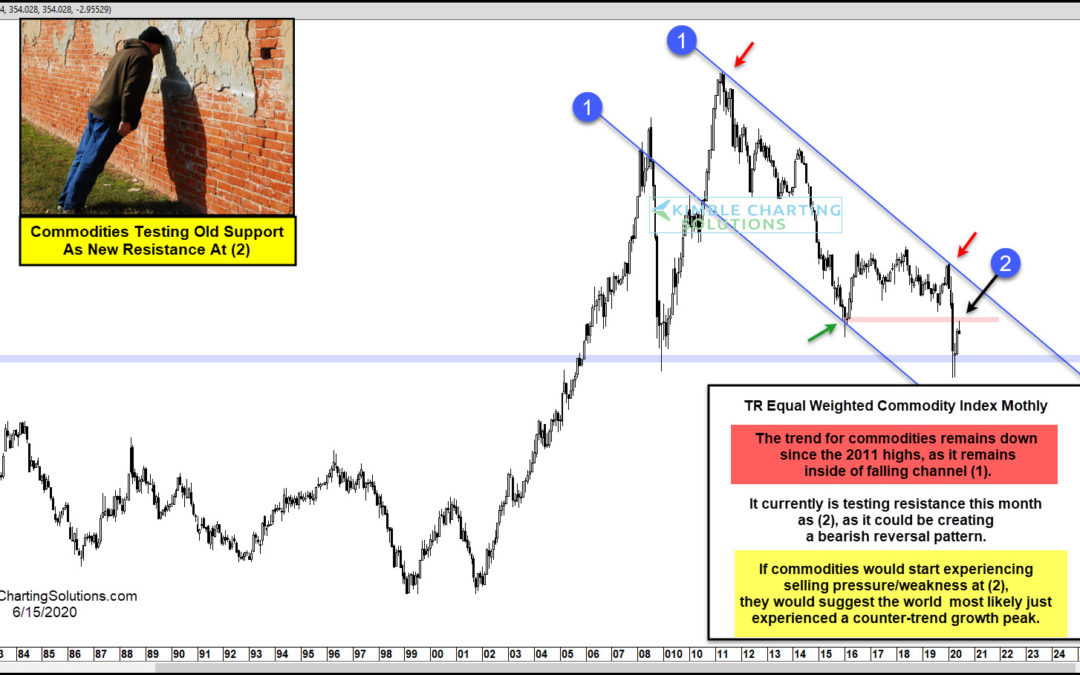
by Chris Kimble | Jun 16, 2020 | Kimble Charting
After peaking in 2011, TR Equal Weighted Commodities index has traded in a tight declining trend channel. The falling trend channel is marked by each (1). As you can see, price recently fell through the support line at (2), leading to lower lows before the recent...
by Chris Kimble | Feb 19, 2018 | Kimble Charting
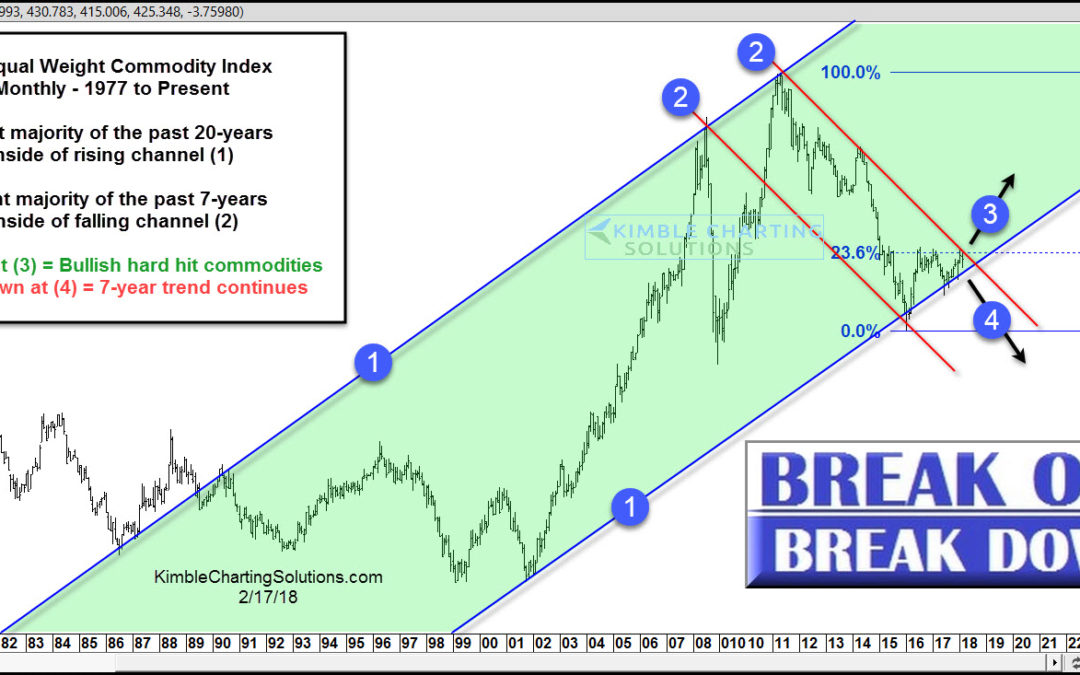
CLICK ON CHART TO ENLARGE The chart above highlights that the Thomson Reuters Equal Weighted Commodity Index has spent the majority of the past 20-years inside of rising channel (1), reflecting that its long-term trend is up. Over the past 7-years, this index has...

by Chris Kimble | Sep 20, 2016 | Kimble Charting
Important Kisses were taking place in the picture above, as some wondered if they would see loved ones again. Below looks at the Thompson/Reuters Commodity index over the past 60-years and how an “important kiss of resistance” might have taken place. CLICK...

by Chris Kimble | Sep 15, 2015 | Kimble Charting
Will the Fed raise rates or not? The media is spewing speculation almost by the minute, about what the Fed will do in regards to interest rates. Is the Fed seeing things that would suggest they need to raise rates? We all are aware the Fed looks at tons of indicators....

by Chris Kimble | Aug 11, 2015 | Kimble Charting, Sector / Commodity
CLICK ON CHART TO ENLARGE Barron’s has been bullish equities for a good while and they have been on track with this call! Now they are suggesting to “Buy Commodities.” Are they on track again? The chart above looks at the Thompson/Reuters Commodity...
