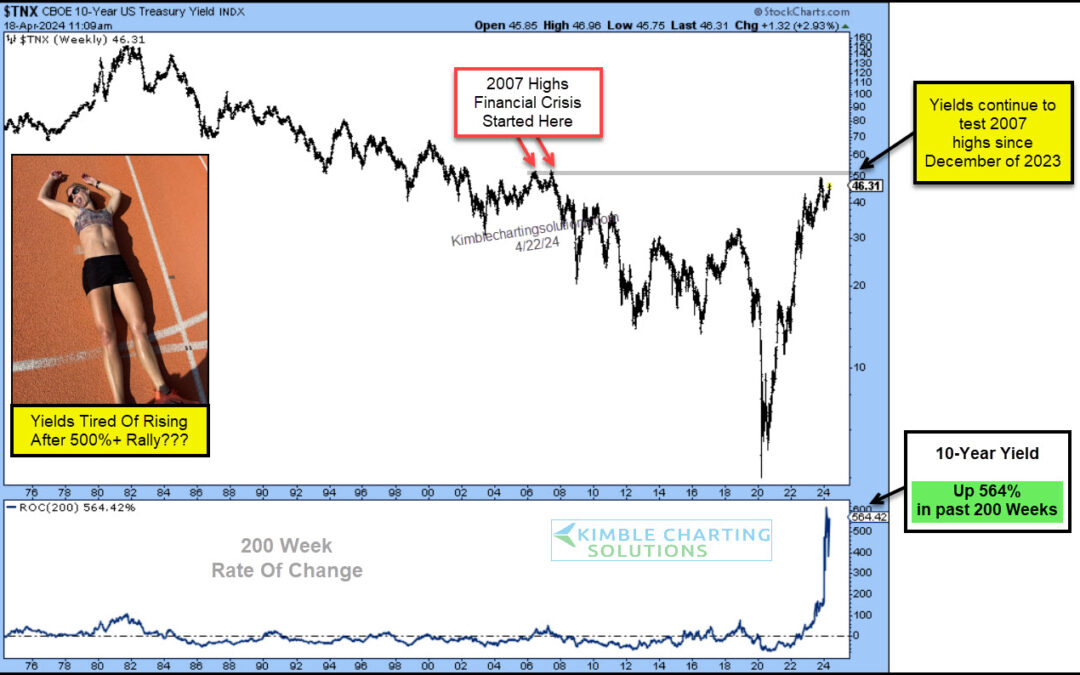
by Chris Kimble | Apr 22, 2024 | Kimble Charting
US Treasury bond yields have been moving higher for the past 4 years. Furthermore, the rally marks the largest 200-week rally in 10-year yield history. Wow! So today, we ask, are yields tired after this big run-up? Is it time for a pullback? Today’s chart highlights...
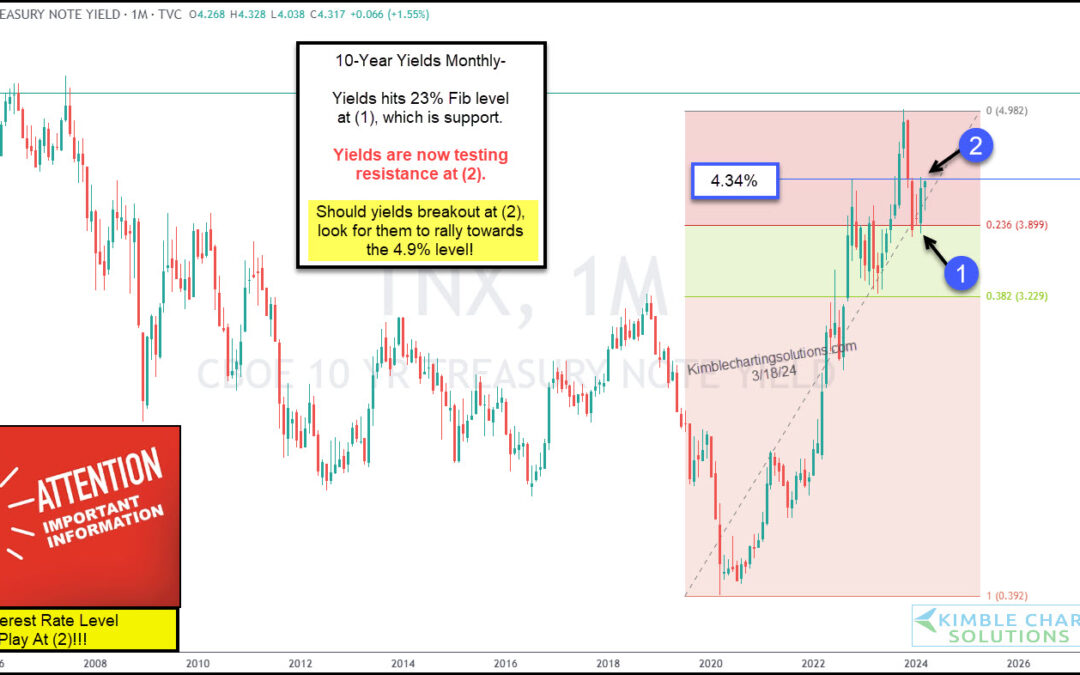
by Chris Kimble | Mar 19, 2024 | Kimble Charting
The 10-year treasury bond yield is very closely watched by banks, consumers, and active investors. It is used as a measuring stick for interest rates on loans, bond auctions, etc. When the 10-year treasury bond yield goes higher, so do interest rates on mortgages,...
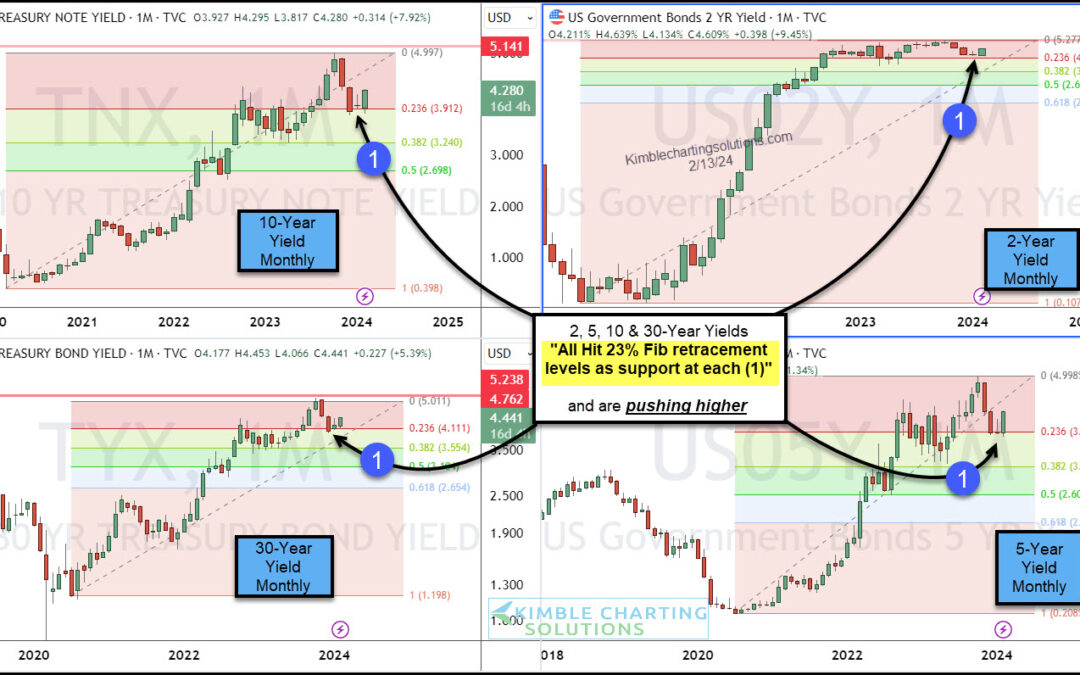
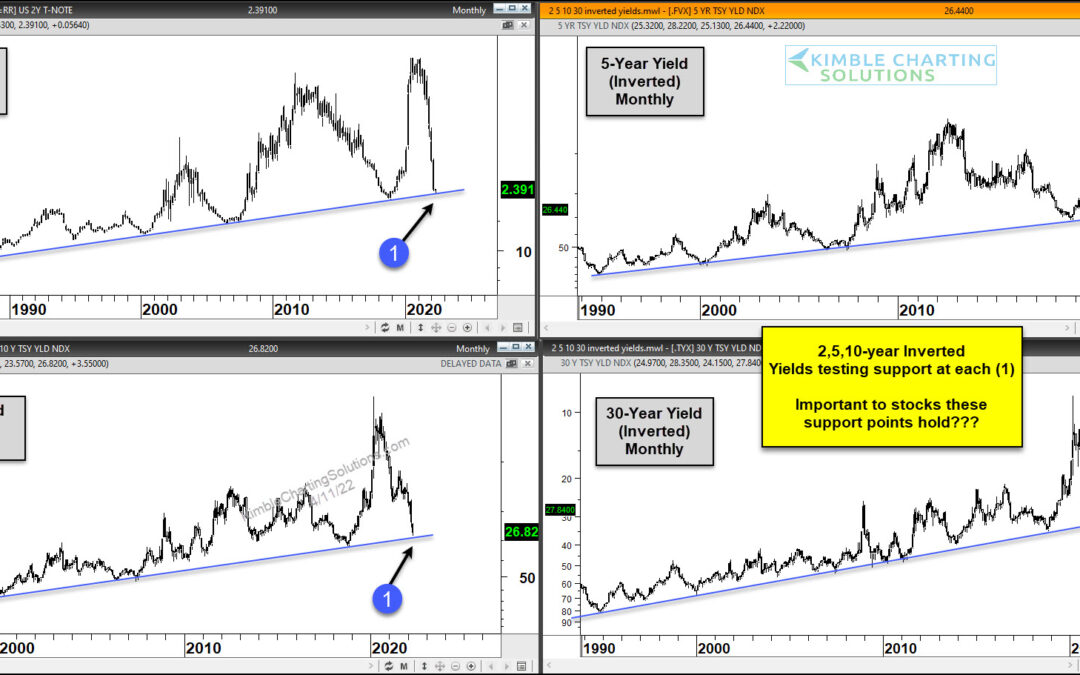
by Chris Kimble | Feb 14, 2024 | Kimble Charting
The past few months have given investors the feeling that the 3 year (monster) rally in treasury bond yields is over. But the lull may be over. And it’s looking like bond yields (interest rates) may be rallying again. Why? Well today’s chart 4-pack looks at treasury...
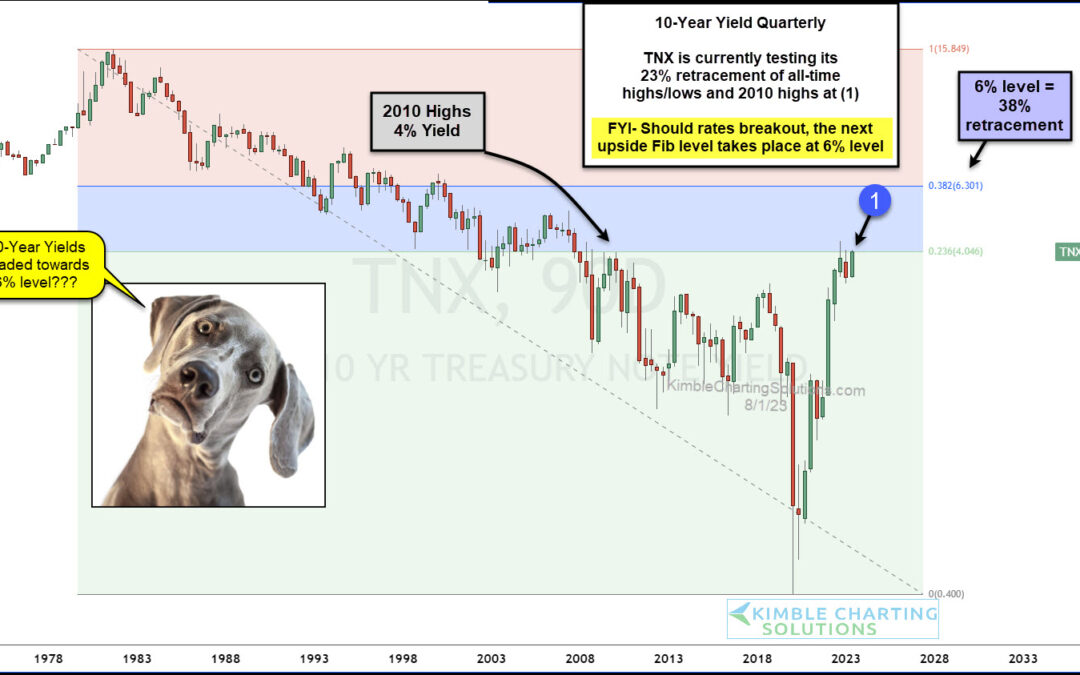
by Chris Kimble | Aug 2, 2023 | Kimble Charting
Interest rates remain in the spotlight with investors watching every economic data release and wondering when the Federal Reserve will stop raising rates. Well, one way to gauge this environment is to watch the 10-Year US Treasury bond yield. And as you guessed, it’s...
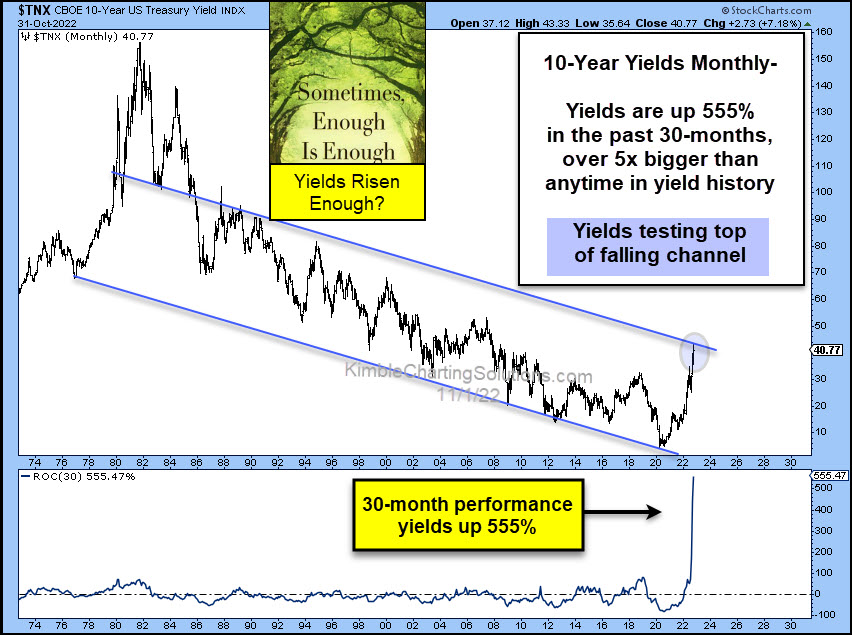
by Chris Kimble | Nov 2, 2022 | Kimble Charting
The rise in interest rates has been meteoric, with mortgage rates reaching levels not seen in nearly 2 decades. The 10-year US treasury bond yield is highly watched as a leading indicator and that yield has risen from near 0 (Covid) to well over 4 percent recently. Is...
by Chris Kimble | Apr 13, 2022 | Kimble Charting
Over the past two years, we have seen inflation soar. And with that has coming rising interest rates. This week’s CPI and PPI data have only confirmed consumers fears. But how much of the latest inflation data is baked into current interest rates? Today we take a look...
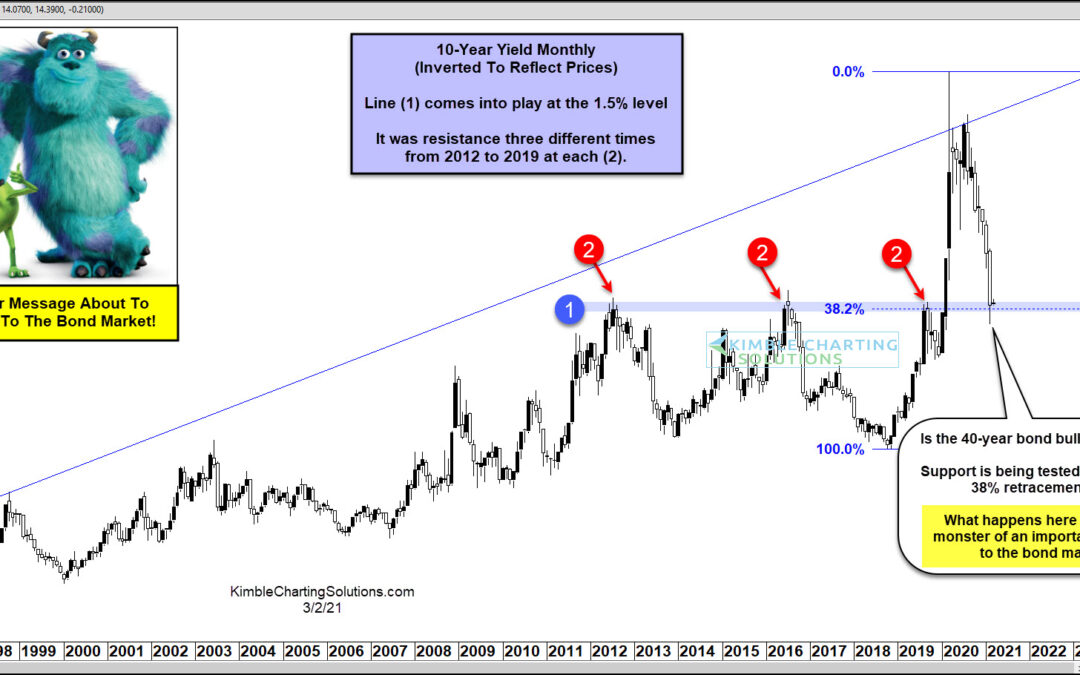
by Chris Kimble | Mar 3, 2021 | Kimble Charting
The bull market in bond prices has steady, durable, and trustworthy. Over the past 40 years, if investors could count on anything, it was rising bonds and falling bond yields (interest rates). But this trend / dynamic may be changing… The post pandemic spike lower in...
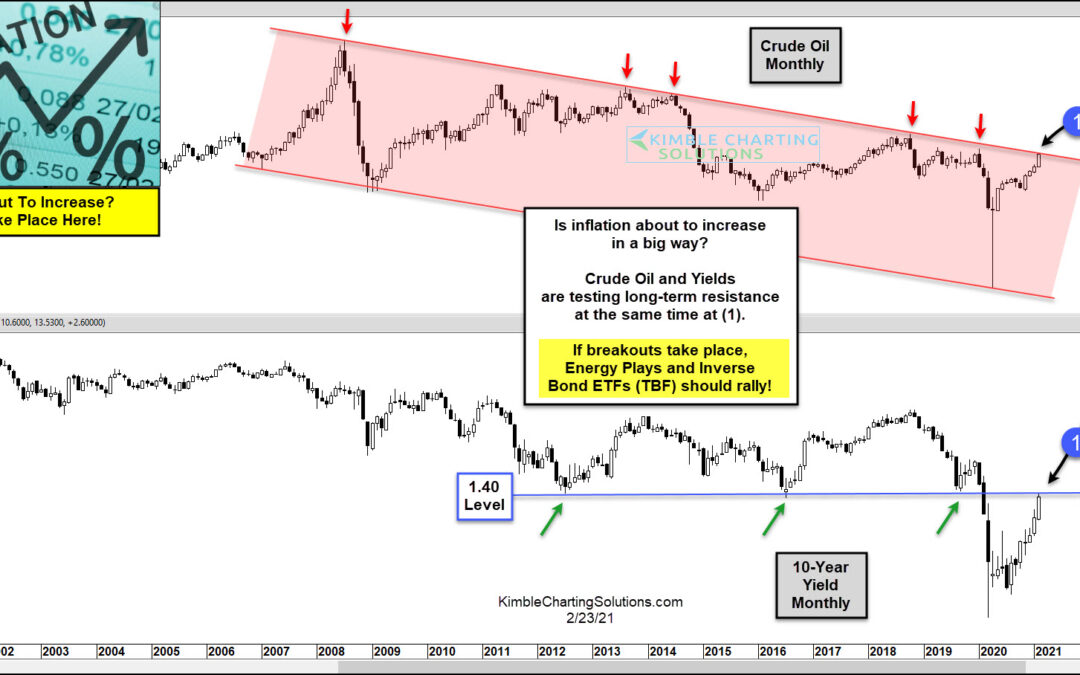
by Chris Kimble | Feb 24, 2021 | Kimble Charting
Inflation seems to be a thing of the past… but current trading in bond and commodity markets tell us that it could become a thing of the future! Inflation hasn’t been an issue, or even on our radar, since the 1980s. Sure, the 2007 surge in oil prices offered some...
