The past few months have given investors the feeling that the 3 year (monster) rally in treasury bond yields is over.
But the lull may be over. And it’s looking like bond yields (interest rates) may be rallying again.
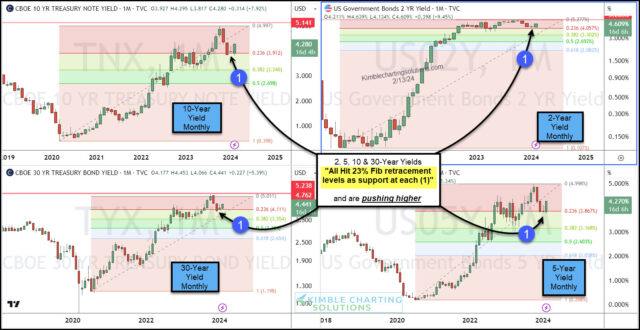
Why? Well today’s chart 4-pack looks at treasury bond yields across all time spectrums (2-year, 5-year, 10-year, and 30-year).
As you can see, whether short or long-term, ALL bond yields pulled back and tagged the 23% Fibonacci retracement level at each (1) and created monthly bullish reversal patterns.
This article was first written for See It Markets.com. To see the original post, CLICK HERE.


