by Chris Kimble | Mar 10, 2023 | Kimble Charting
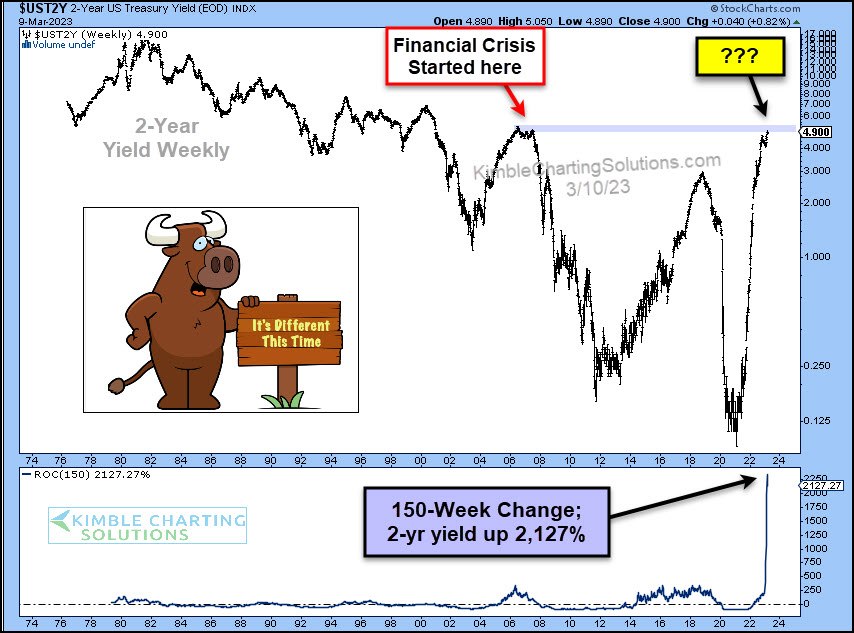
With bond yields (and interest rates) rising sharply, it’s understandable that most of the world is hoping for lower rates. Lower interest rates allow for more flexible lending to both businesses and consumers… BUT… As the “weekly” chart below shows, the last time...
by Chris Kimble | Oct 26, 2022 | Kimble Charting
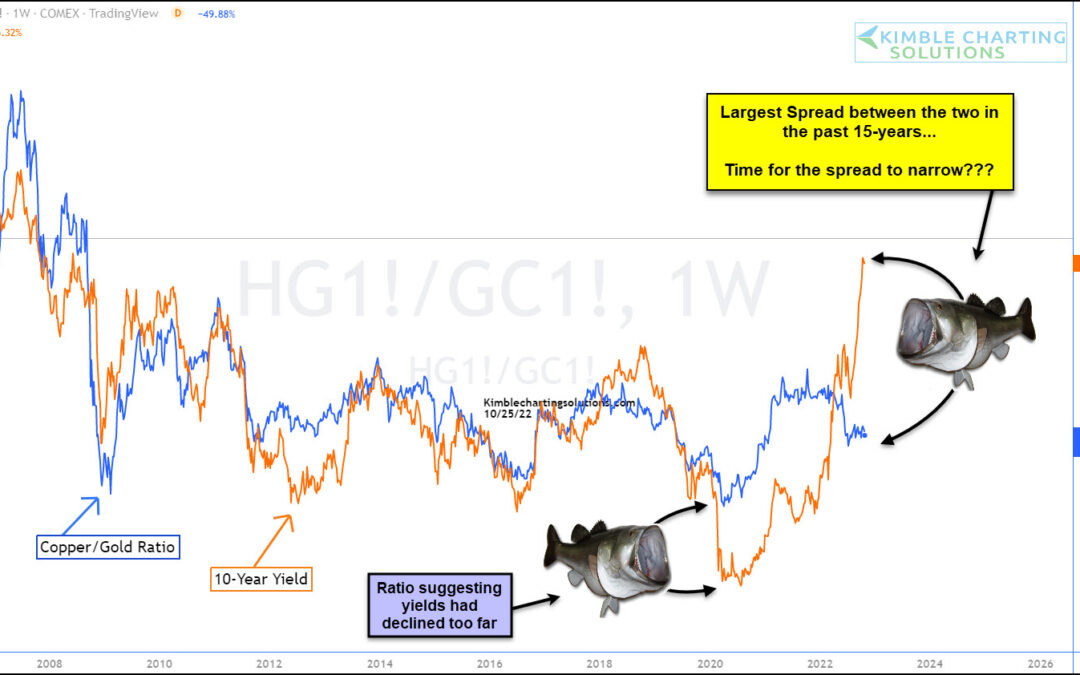
The price of copper to gold has been a correlation that has followed 10-Year US Treasury bond yields (in trend) fairly closely. This correlation has been one that I’ve followed to see if bond yields are changing trend, or if the trend has become overdone. Today, this...
by Chris Kimble | Oct 8, 2018 | Kimble Charting
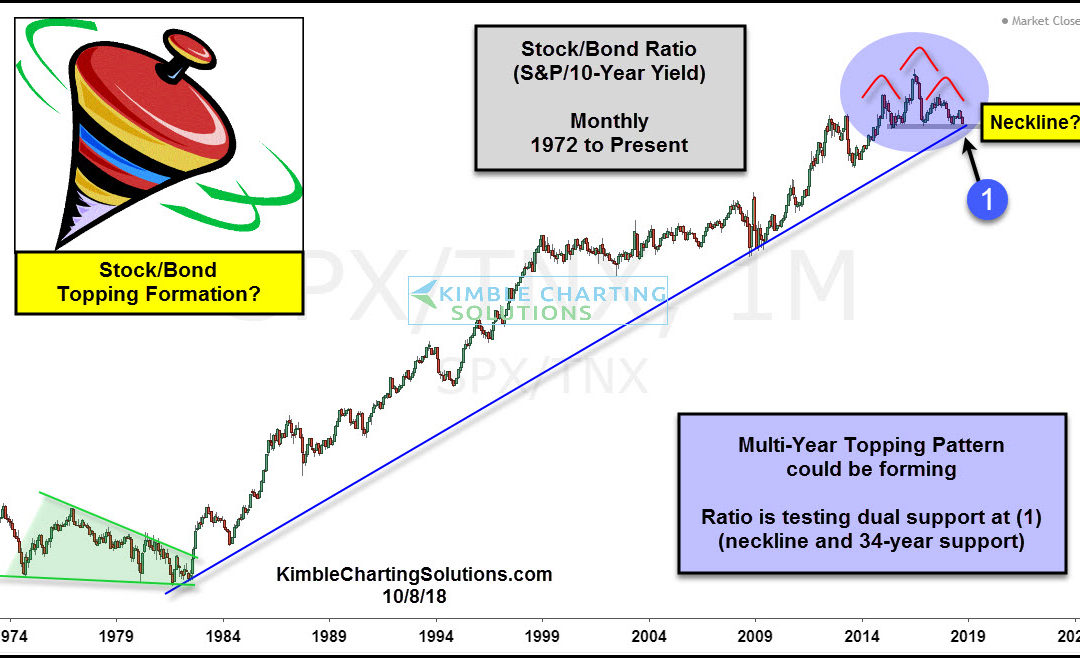
CLICK ON CHART TO ENLARGE This chart compares the relative strength of Stocks to bonds by creating the S&P 500/10-Year yield ratio (SPX/TNX) on a monthly basis, since the mid-1970’s. The stock/bond ratio’s trend has been up for the past 34-years,...
by Chris Kimble | Aug 28, 2018 | Kimble Charting
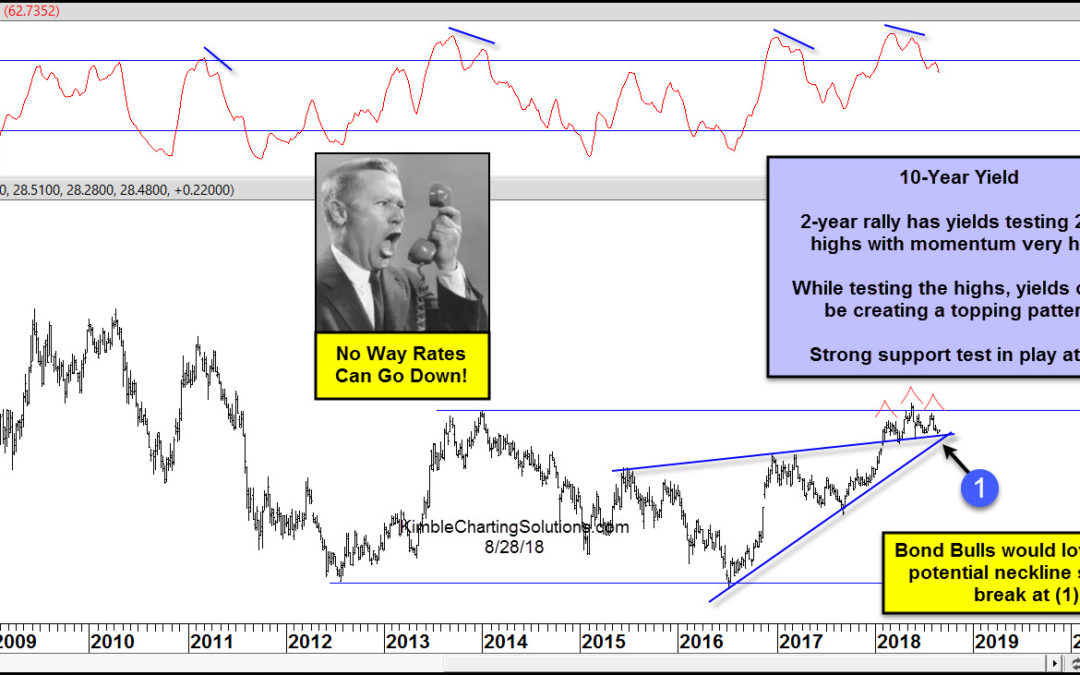
CLICK ON CHART TO ENLARGE With numerous stock indices hitting all-time highs, is it possible that interest rates could be peaking? It does seem unlikely in my humble opinion. This chart looks at the yield of the 10-year note (TNX), over the past 10-years. The rally...
by Chris Kimble | Jul 18, 2018 | Kimble Charting
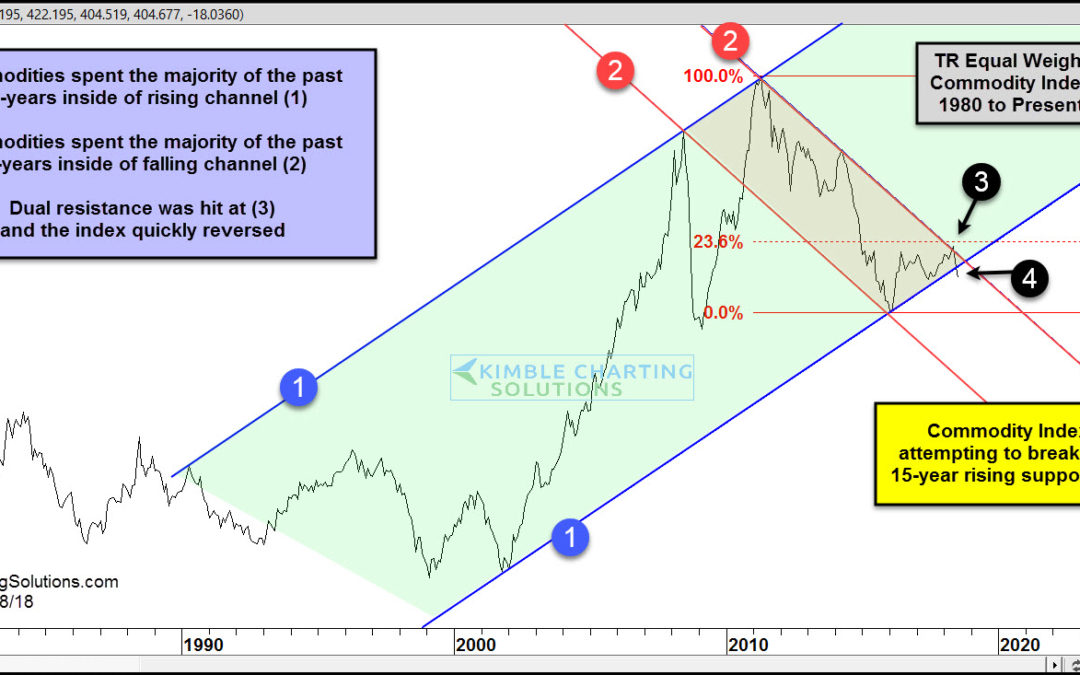
CLICK ON CHART TO ENLARGE The chart looks at the Thomson Reuters Commodity Index over the past 38-years, on a monthly closing basis. The index has been creating a series of higher lows and higher highs over the past 15-years inside of rising channel (1). It hit the...
by Chris Kimble | Jul 10, 2018 | Kimble Charting
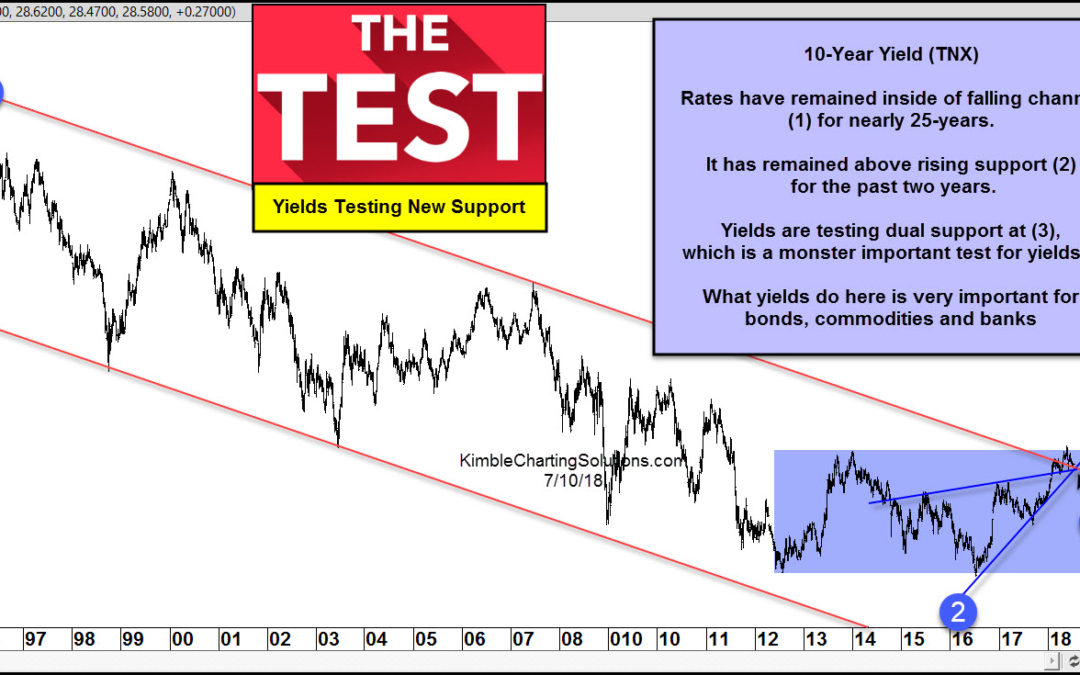
CLICK ON CHART TO ENLARGE This chart looks at the Yield on the 10-year note (TNX) over the past 25-years. Yields have spent the majority of the past couple of decades inside of falling channel (1). Yields have been pushing higher since the lows in 2016 where they have...

by Chris Kimble | Jan 23, 2018 | Kimble Charting
Ole Doc Copper has had a rough go of it when looking back over the past 7-years, as it peaked in 2011. Ole Doc Copper has experienced nice gains over the past two years, as a strong counter-trend rally has taken place. Below looks at Copper Futures over the past...

by Chris Kimble | Jun 15, 2017 | Kimble Charting
When it come to performance so far this year, would one be better off owning the S&P 500 or Long-Term Zero coupon bonds? Below compares the S&P 500 to Pimco’s Zero Coupon Bond ETF (ZROZ). So far this year, both have done well and pretty much have the...


