
CLICK ON CHART TO ENLARGE
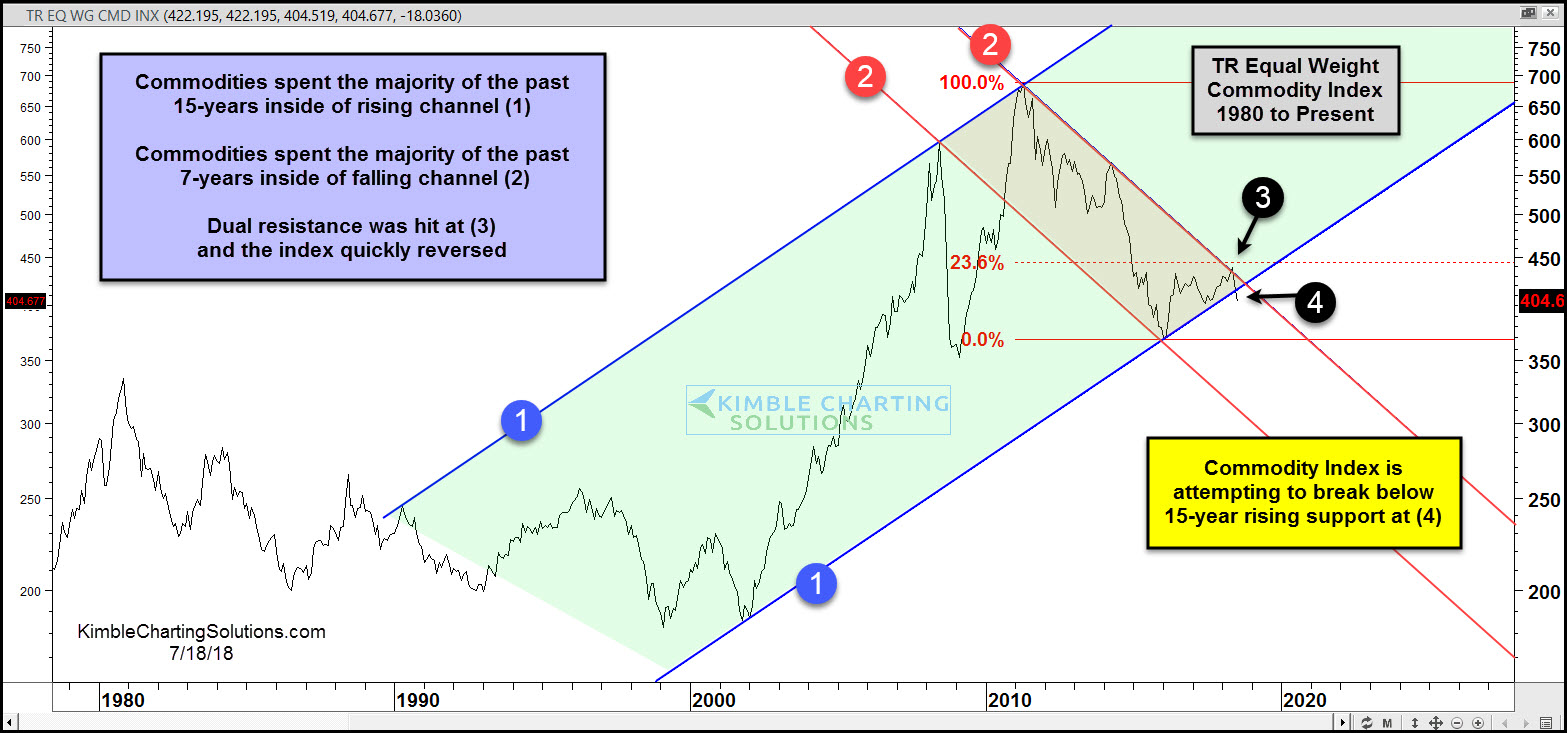
The chart looks at the Thomson Reuters Commodity Index over the past 38-years, on a monthly closing basis.
The index has been creating a series of higher lows and higher highs over the past 15-years inside of rising channel (1). It hit the top of the rising channel (1) back in 2011 and since then it has created a series of lower highs and lower lows inside of the falling channel (2).
The index hit the top of the falling channel and its 23% Fibonacci retracement level last month at (3) and quickly turned lower.
The weakness of late now has this important commodity index attempting to break 15-year rising support at (4). Should the index continue to head lower, it could be sending a key message about global growth. Keep a close eye on the index going forward, as it could have an impact on bonds, interest rates, bank stocks, and precious metals.
–
