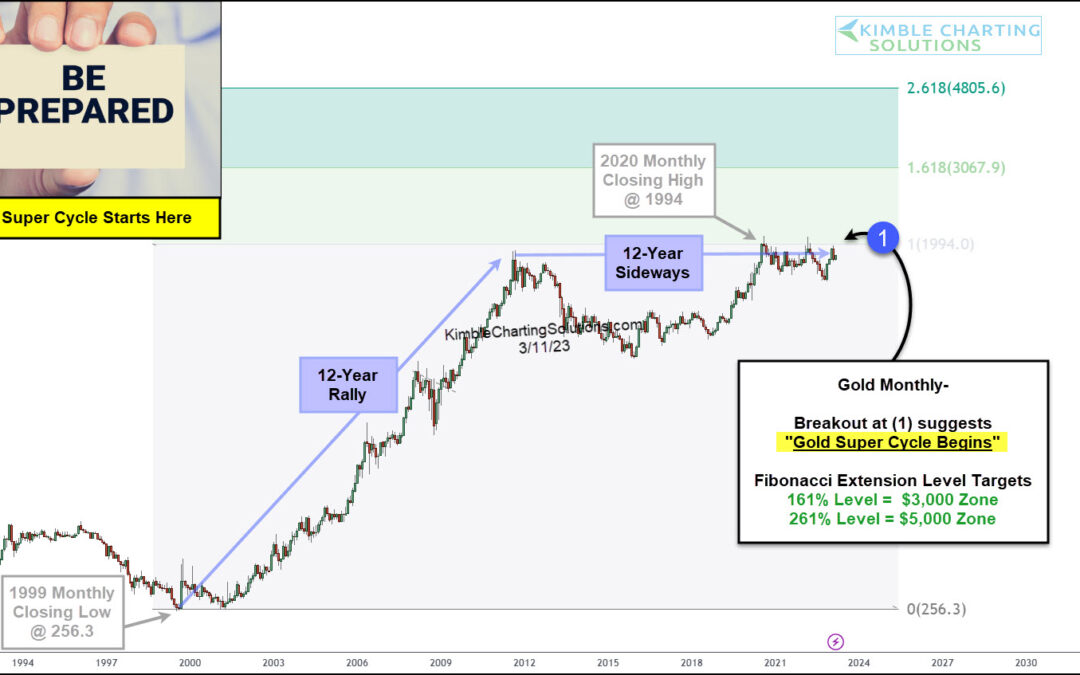
by Chris Kimble | Mar 13, 2023 | Kimble Charting
Nearly 12 years ago on 9/1/2011, I pointed to “the power of the pattern” and suggested that Gold should be flat to down for years to come. And, if you look at the chart below, you can see that this unfolded as expected. Fast forward to today (12-years later), and...
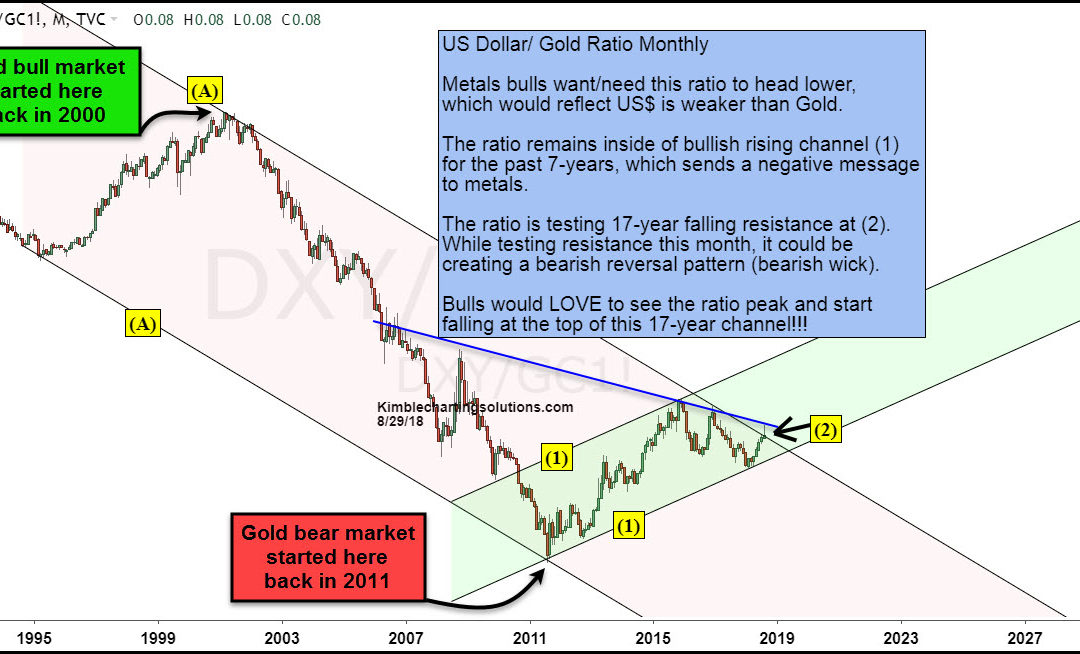
by Chris Kimble | Aug 30, 2018 | Kimble Charting
CLICK ON CHART TO ENLARGE This chart looks at the US Dollar/Gold ratio on a monthly basis over the past 25-years. When the ratio peaked back in 2000/2001 the great bull run for Gold and Silver got started. The bull run for metals continued until the ratio bottomed...
by Chris Kimble | May 4, 2017 | Kimble Charting
Below looks at Gold Futures over the the past 8-years, reflecting that Gold remains in a clean bear channel (A) since 2011. Gold made another attempt to break free of this falling channel three weeks ago, only to be turned away again, disappointing Gold bulls again....

by Chris Kimble | Apr 7, 2017 | Kimble Charting
Since the first day after Christmas last year (12/27/16), the metals space has been a great place to be. Below looks at performance of several metals assets compared to the S&P 500 since this date. CLICK ON CHART TO ENLARGE Premium and Metals members went long...
by Chris Kimble | Apr 4, 2017 | Kimble Charting
Hard to believe that Silver hit $50 an ounce in 2011? Even though Silver is off to a good start in 2017 (up near 14%), it remains over 50% below the highs of 6-years ago. Below looks at Silver on a monthly basis, over the past 40-years. CLICK ON CHART TO ENLARGE...

by Chris Kimble | Mar 23, 2017 | Kimble Charting
From 2001 to 2011, would you have rather owned the S&P 500 or Gold Miners (Gold Bugs Index/HUI)? If you answered the Gold Bugs index, you would be correct. The left chart below compares the performance of the Gold Bugs Index and the S&P 500. From 2001 to 2011,...
by Chris Kimble | Mar 13, 2017 | Kimble Charting
Gold & Silver Mining stocks have had a rough few weeks, falling in excess of 15%, after a sharp post Christmas rally. Are they in trouble or about to bounce of newly created rising channel support? Below looks at the Gold Bugs Index (HUI) over the past few years....
by Chris Kimble | Feb 16, 2017 | Kimble Charting
The majority of stock indices in the states are doing great this year and most are either hitting all-time highs or very near them. The Power of the Pattern shared at the beginning of the year that the Gold Bugs Index (HUI) and miners, could be poised to out perform...
