
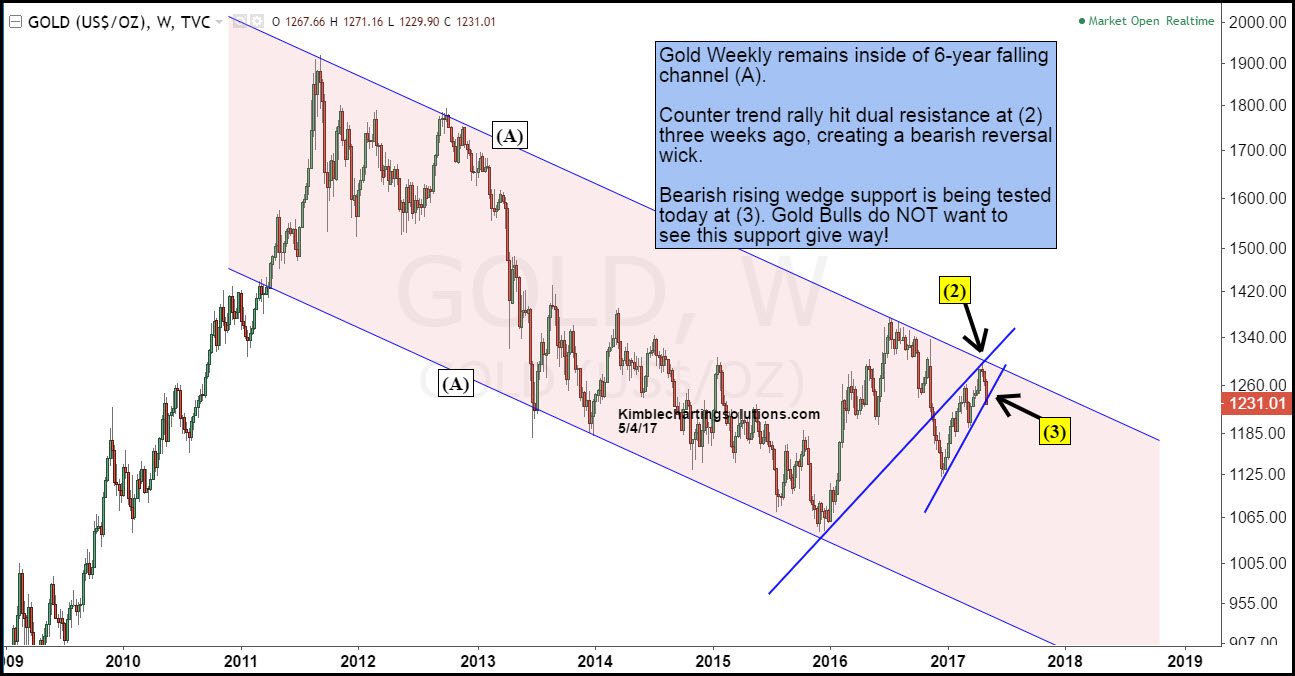
Below looks at Gold Futures over the the past 8-years, reflecting that Gold remains in a clean bear channel (A) since 2011. Gold made another attempt to break free of this falling channel three weeks ago, only to be turned away again, disappointing Gold bulls again.
Today, Gold faces a “slipping risk” price point in the chart below at (3).
CLICK ON CHART TO ENLARGE
Three weeks ago, Gold attempted to breakout from falling channel (A) at (2). Results, Gold created a bearish reversal wick, at dual resistance. Since then, sellers have come forward, pushing Gold lower. This morning, Gold is testing bearish rising wedge support at (3). Slipping risk in play!
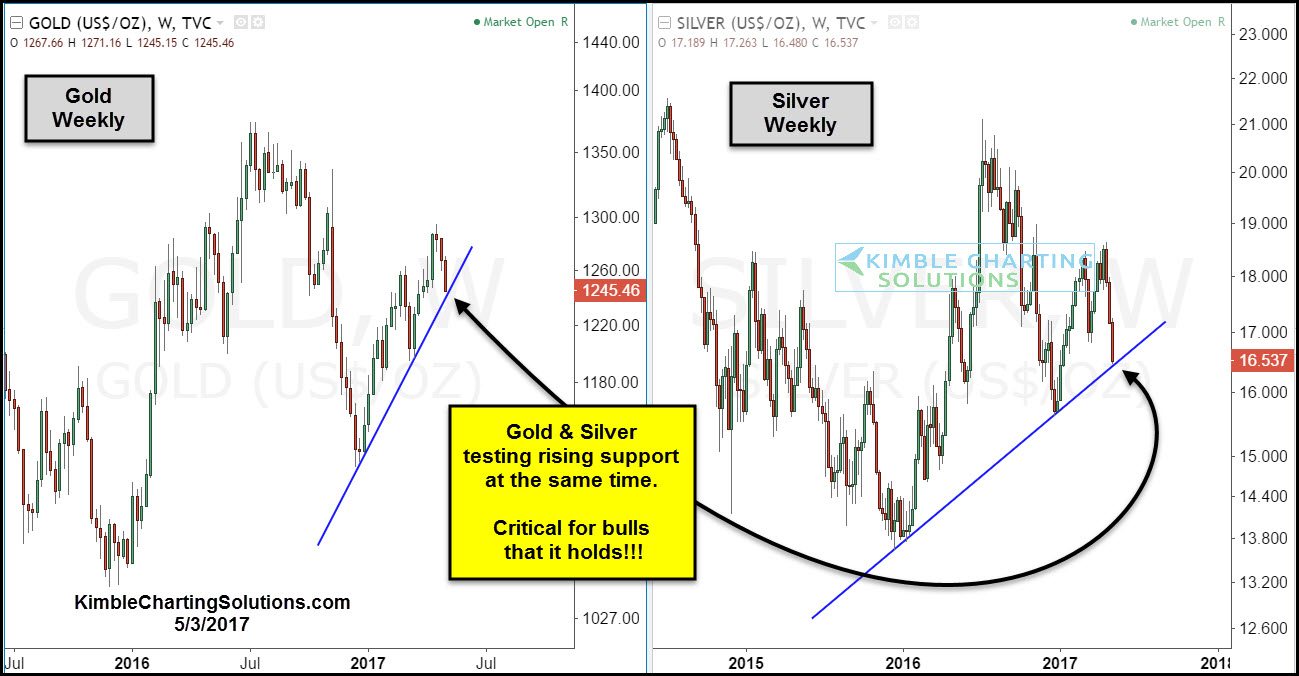
Gold isn’t the only metals asset that finds itself facing a “slipping risk!”
CLICK ON CHART TO ENLARGE
Silver also remains in a bear market since 2011 highs, creating a series of lower highs, similar to Gold. Silver in the right chart above is facing rising support, that if broken to the downside, would increase selling pressure.
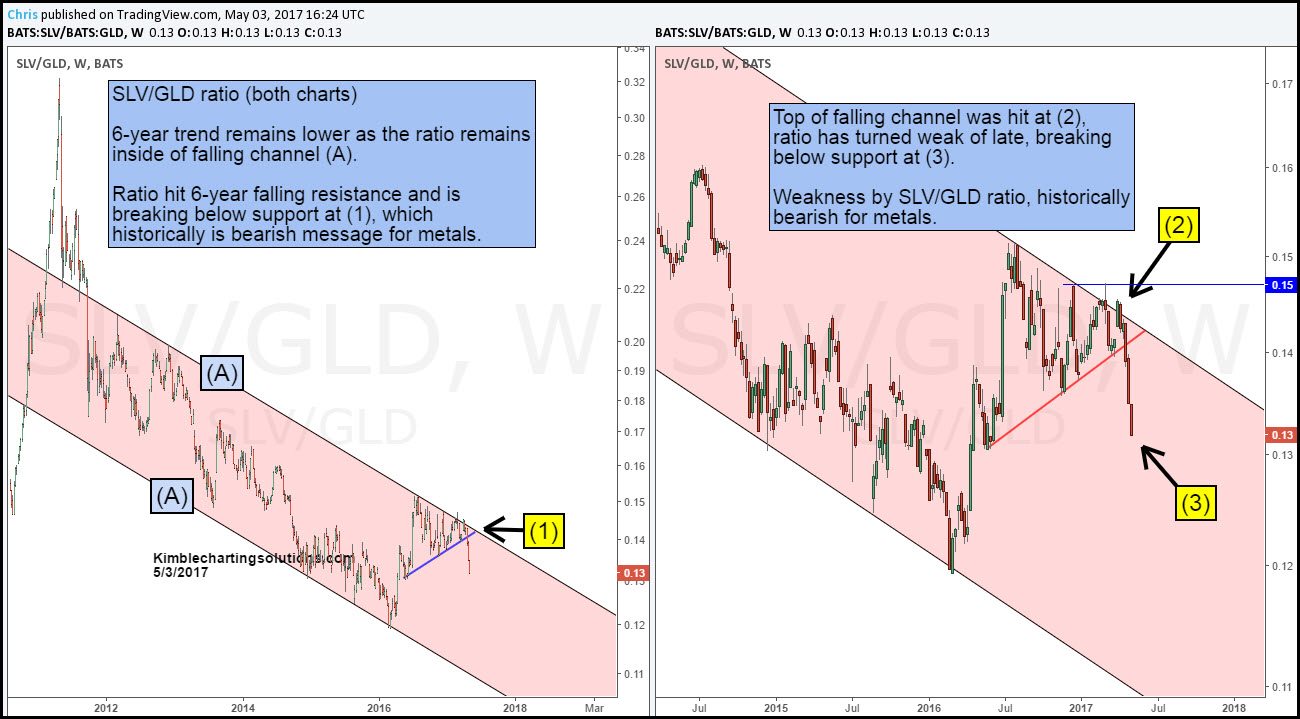
Below looks at the Silver/Gold ratio that we share weekly with Premium and Metals Members. This ratio has been sending a long-term bearish message to this space for years.
CLICK ON CHART TO ENLARGE
To be long and strong owners of Gold & Silver, one wants/needs to see the Silver/Gold ratio to be heading higher. This ratio has remained inside of falling channel (A) in the left chart above since 2011. 6-year falling resistance was hit at (2) five weeks ago, where it reversed course and then proceed to break 9-month rising support. Further weakness then followed at (3). The Power of the Pattern has been sharing with our members since 2011, to treat all rallies as counter trend rallies until falling channel (A) can be taken out to the upside.
If you are interested in short, intermediate and long-term Power of the Pattern signals on this space, we would be honored if you were a Premium or Metals Member.
