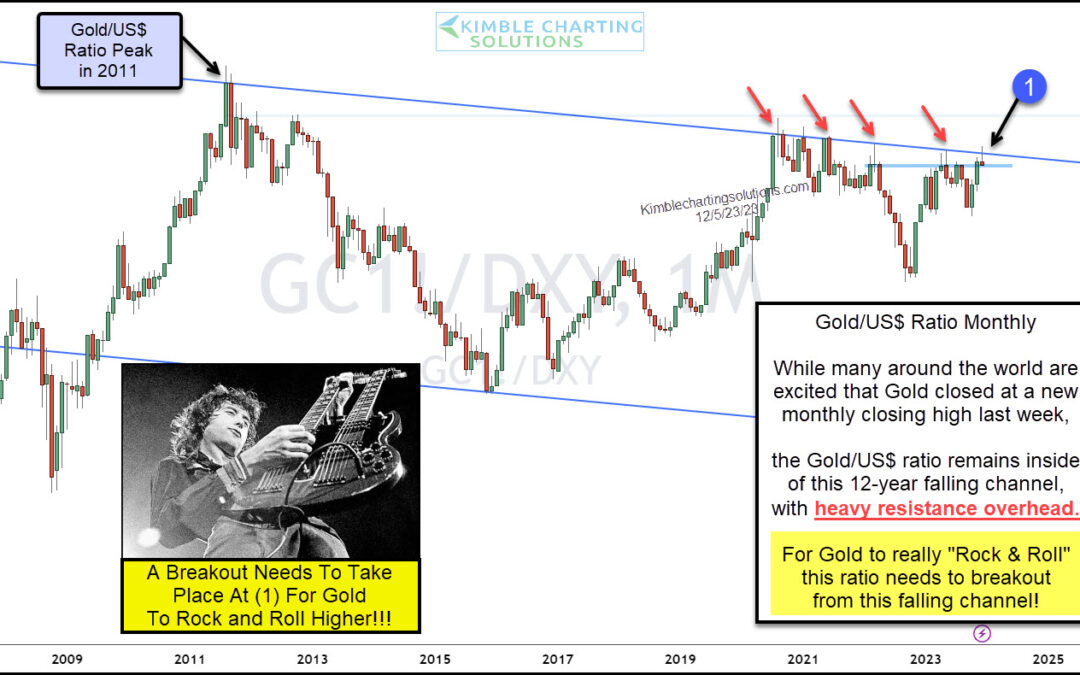
by Chris Kimble | Dec 6, 2023 | Kimble Charting
Precious metals prices have been creeping higher with Gold trading over $2000/oz. A weaker US Dollar has provided a nice tailwind and Gold bugs celebrated a new monthly closing high last week… So, is it time for Gold to finally break out to new all-time highs? Well,...
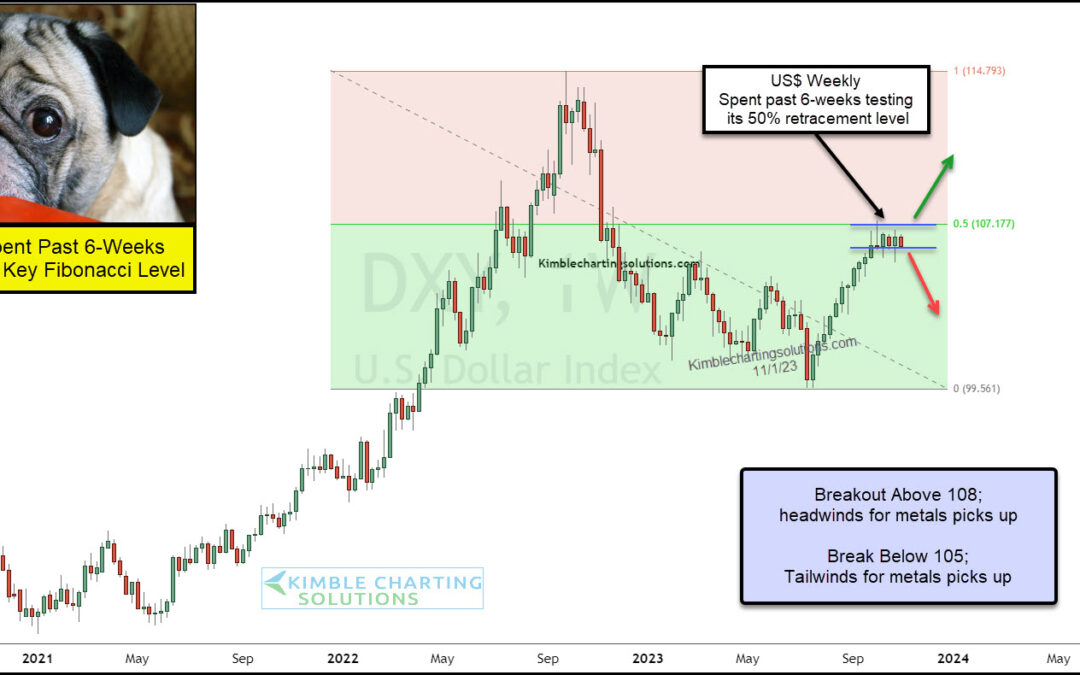
by Chris Kimble | Nov 3, 2023 | Kimble Charting
The U.S. Dollar rally has taken a breather, with the King of the currency world trading sideways for the past several weeks. But there is a reason for this pause, as you can see in today’s “weekly” chart of the U.S. Dollar Index. King Dollar ran into its 50% Fibonacci...
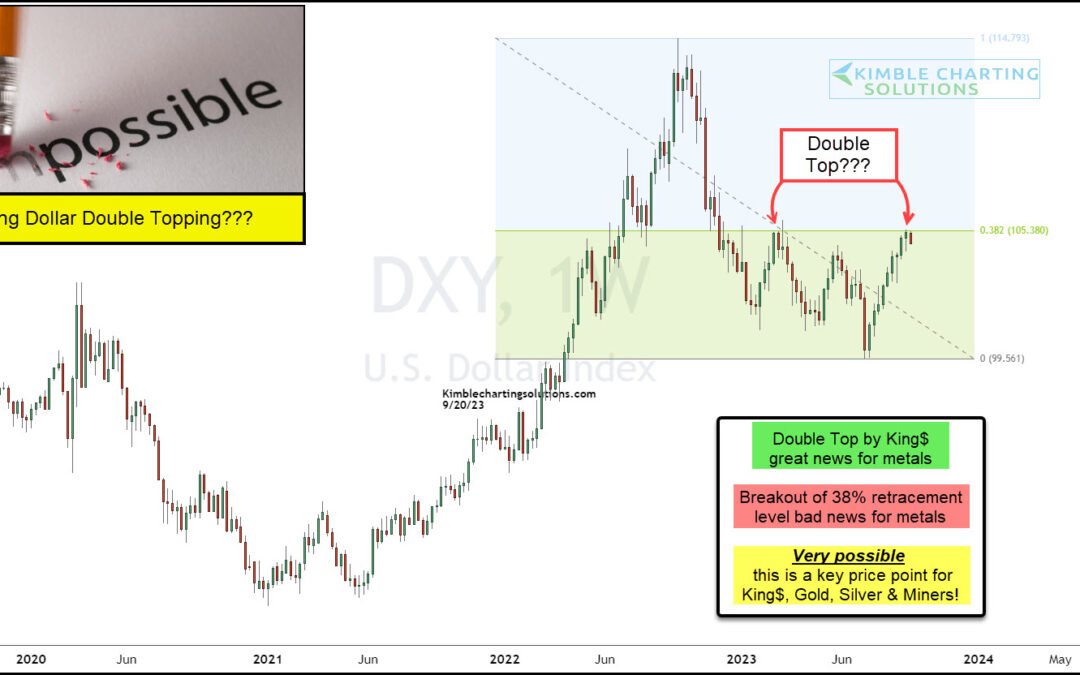
by Chris Kimble | Sep 21, 2023 | Kimble Charting
When the U.S. Dollar is rallying and at full strength, it is a clear headwind for precious metals like gold and silver. But when King Dollar loses his crown and is weakening, it is a clear tailwind for precious metals. Today’s chart of the U.S. Dollar Index highlights...
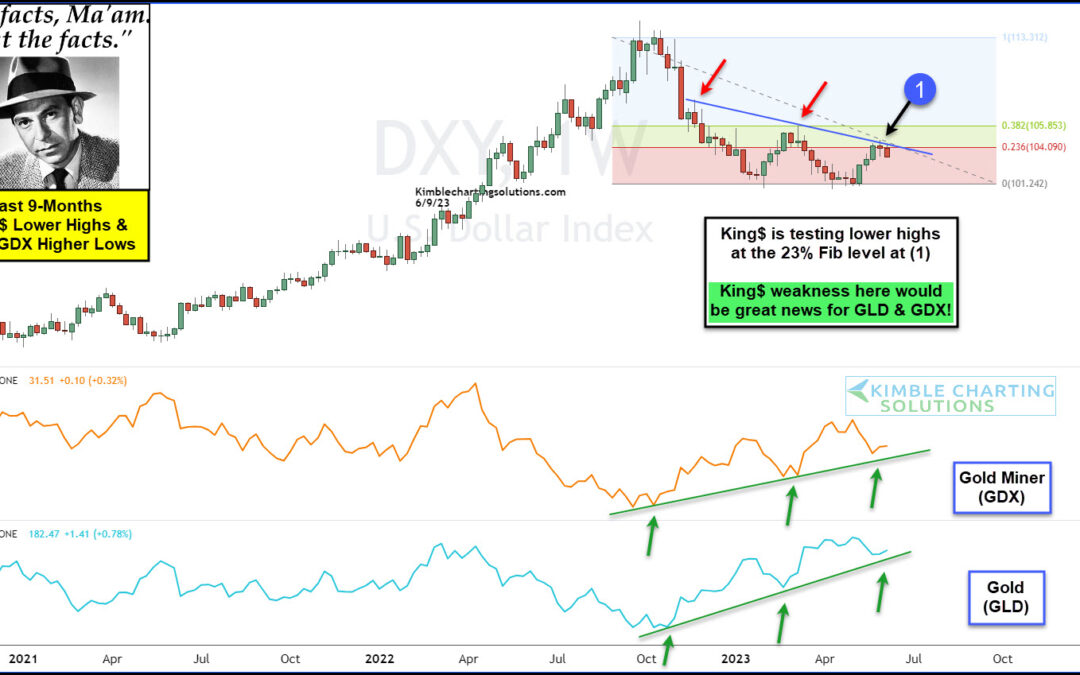
by Chris Kimble | Jun 9, 2023 | Kimble Charting
When the U.S. Dollar is strong, it is a headwind for precious metals. And when the U.S. Dollar is weak, it is a tailwind for precious metals. Today we check in on this relationship by looking at a “weekly” chart of the U.S. Dollar versus the Gold Miners ETF (GDX) and...

by Chris Kimble | May 10, 2023 | Kimble Charting
The precious metals sector has remained elevated, yet volatile, over the past two years. Call it consolidation, but in my humble opinion, something has got to give. Inflation, war, politics… gold bulls have the catalysts and tailwinds to see higher prices. Today, we...
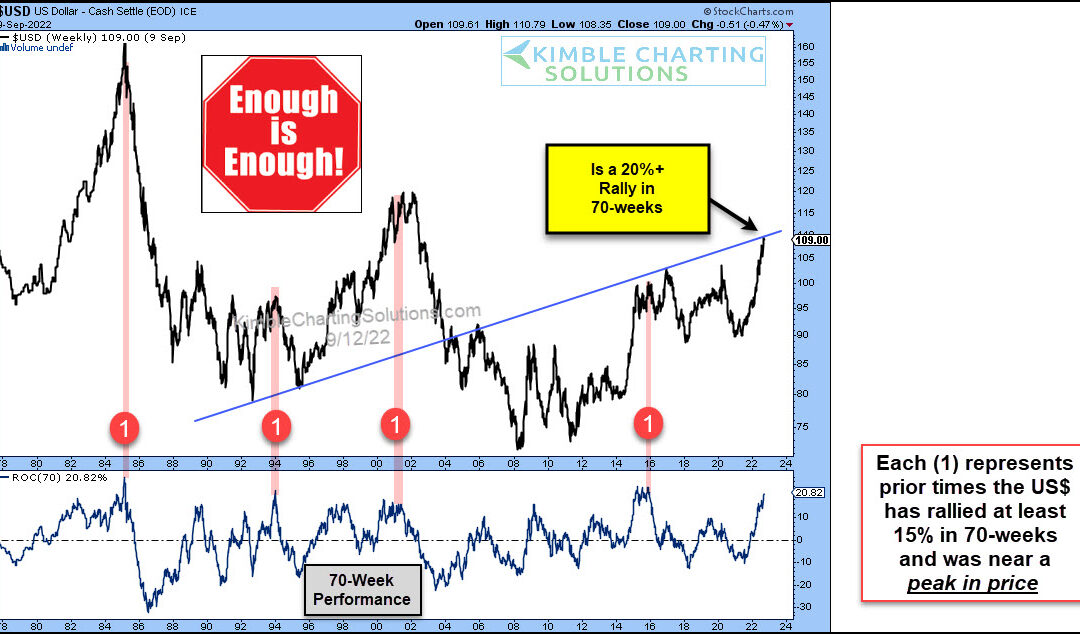
by Chris Kimble | Sep 13, 2022 | Kimble Charting
The US Dollar is strengthening along side rising interest rates. In fact, both are rocketing higher as inflation takes root and the European economy (and the Euro) weakens. Today we look for clues via the long-term “weekly” chart of the US Dollar Index. As you can...
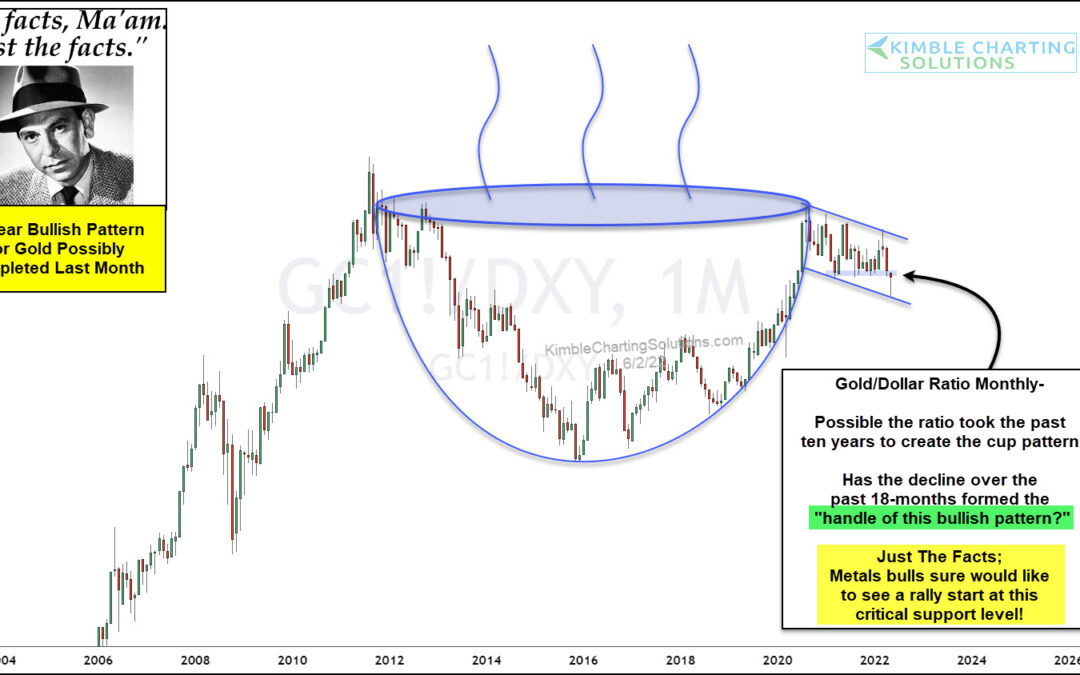
by Chris Kimble | Jun 3, 2022 | Kimble Charting
Gold prices and precious metals bulls have been biding their time. While gold has traded sideways-to-lower, bullish investors have simple sat tight, waiting for a bigger move. I have shared today’s chart pattern several times (read this article from over a year ago),...
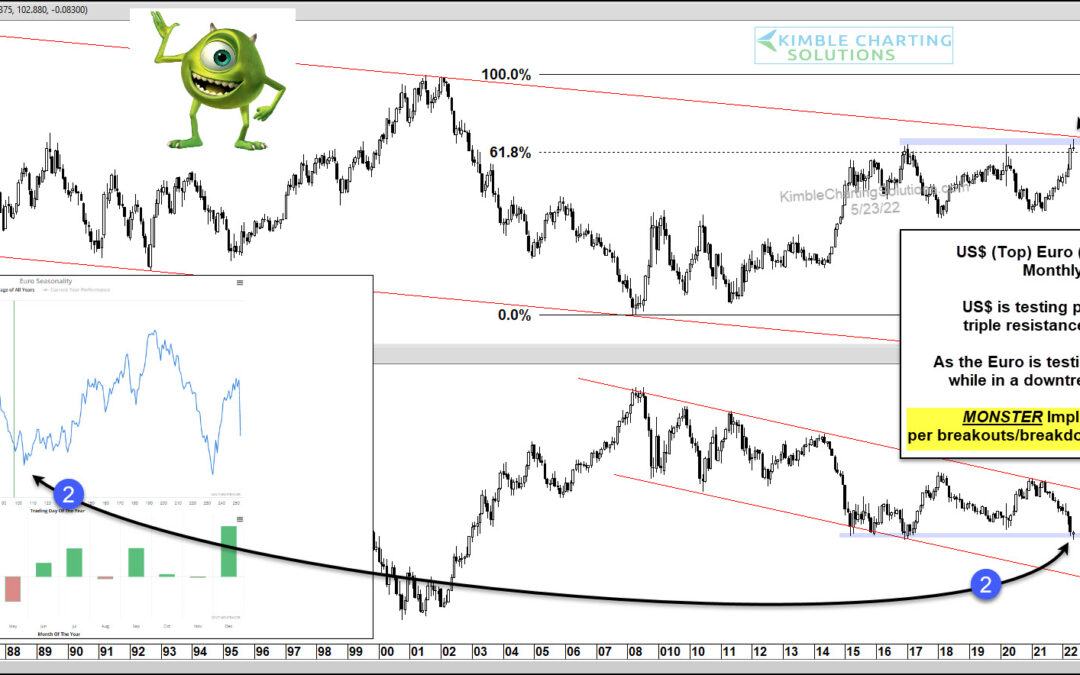
by Chris Kimble | May 23, 2022 | Kimble Charting
The past several months has seen the US Dollar Index rally once more, pushing King Dollar up to a retest of multi-year highs. At the same time, the Euro has been sputtering and is nearing multi-year lows. In today’s long-term “monthly” chart 2-pack, we look at both...
