
Gold prices and precious metals bulls have been biding their time.
While gold has traded sideways-to-lower, bullish investors have simple sat tight, waiting for a bigger move.
I have shared today’s chart pattern several times (read this article from over a year ago), but it seems important to update once again as we ask the question, “Is a big move nearing?”
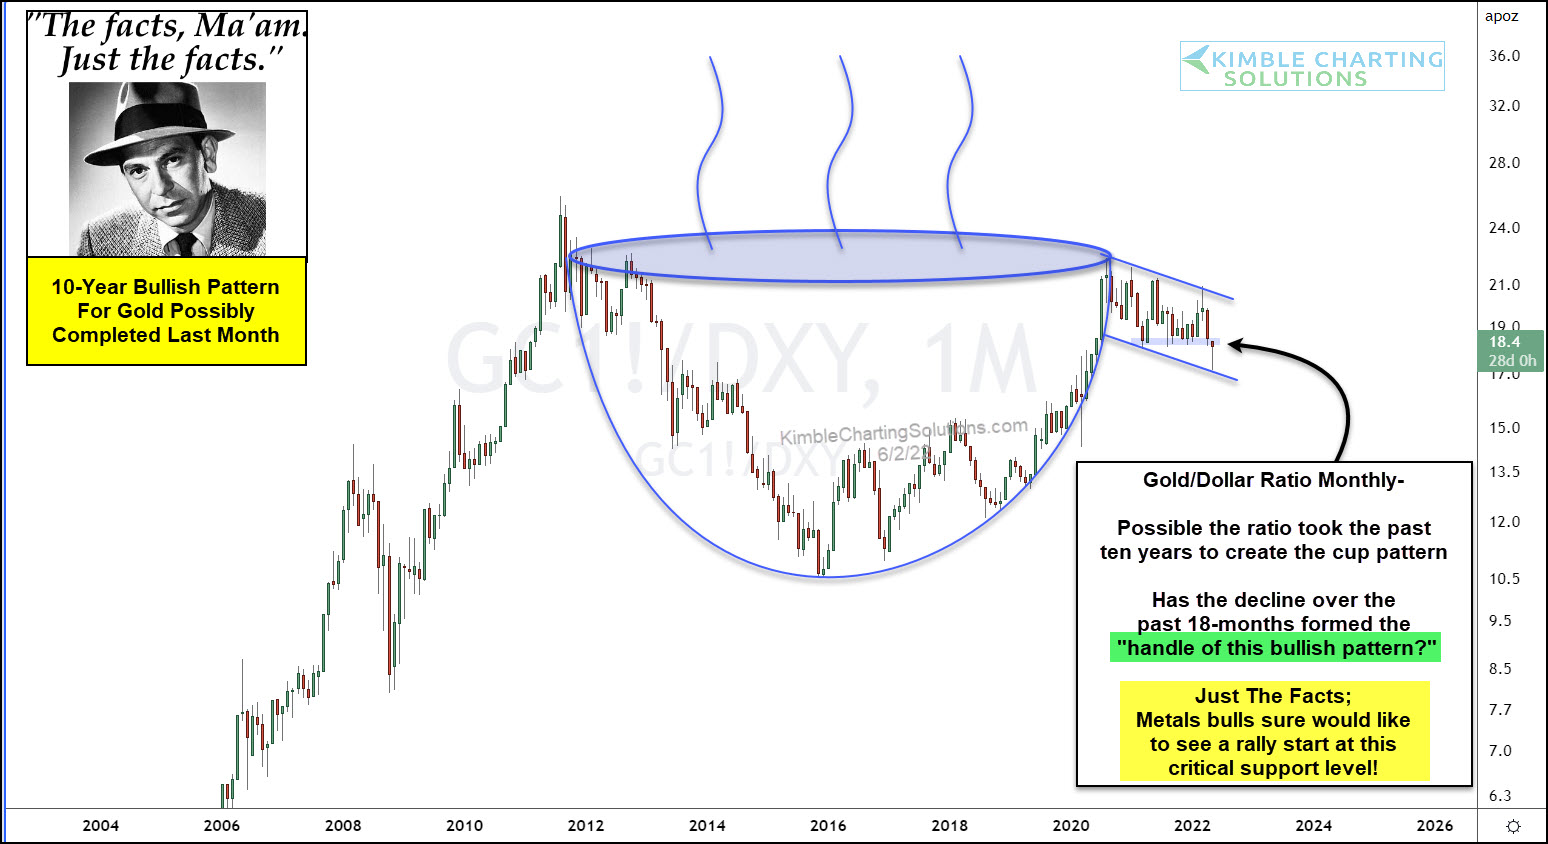
“The facts, Ma’am. Just the facts.”
Looking at today’s chart, we will channel our inner Joe Friday to flesh out the facts. Below is a long-term “monthly” chart of the Gold / U.S. Dollar ratio.
After a sharp rise into 2011, this gold ratio declined sharply over several years… before bottoming and rising sharply into 2020. This formed a bullish “cup” pattern. And it appears the past 18 months may have formed the “handle”.
A bullish reversal pattern could be in play as Gold attempts to hold on to near-term support. Just the facts: Metals bulls sure would like to see a rally start right here! Stay tuned!
This article was first written for See It Markets.com. To see the original post CLICK HERE.
