by Chris Kimble | Nov 26, 2021 | Kimble Charting
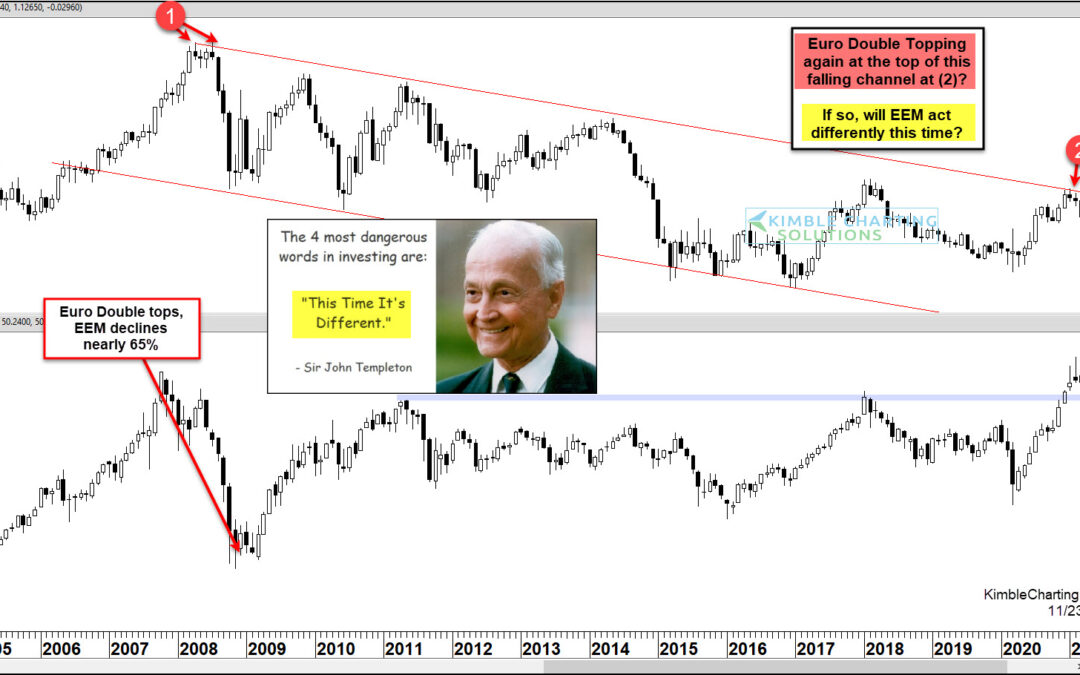
The Euro currency is sliding and international markets are taking notice. Of course, this is coming as the US Dollar rallies… and all this means pain for the Emerging Markets and its trading ETF (EEM). In today’s chart 2-pack, we compare the Euro to the Emerging...
by Chris Kimble | Sep 24, 2021 | Kimble Charting
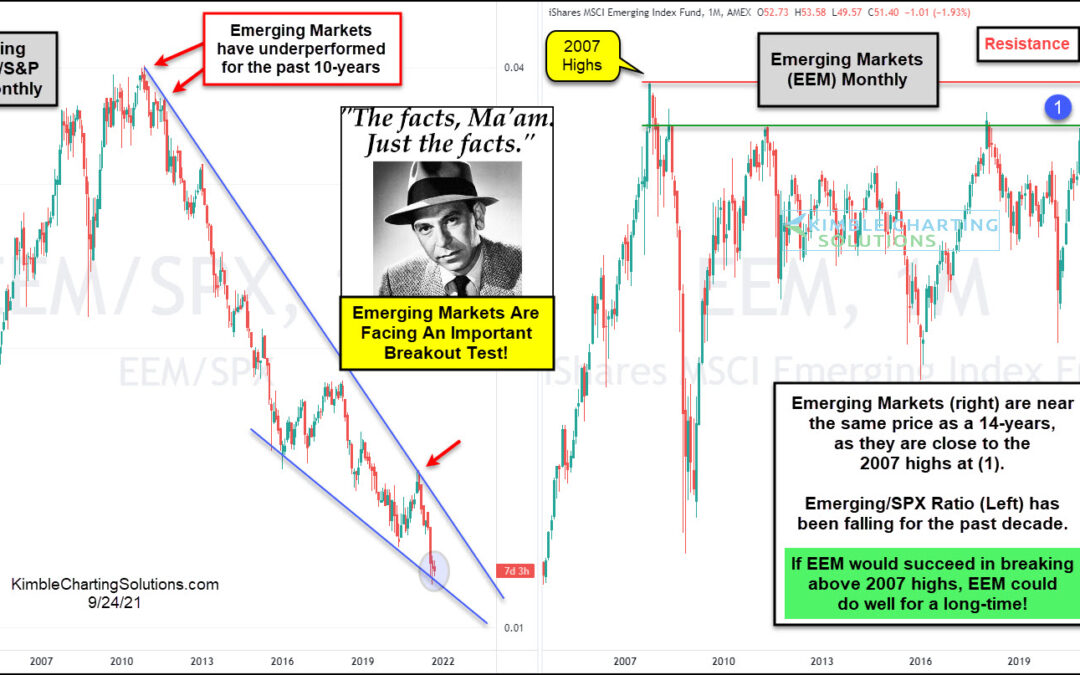
The emerging markets were the place to be for investors in the early 2000’s. BRIC (Brazil, Russia, India, China) was all the rage and investors desire to include exposure to these countries lead to a strong performance for emerging markets. That is, until the 2008...
by Chris Kimble | Aug 17, 2021 | Kimble Charting
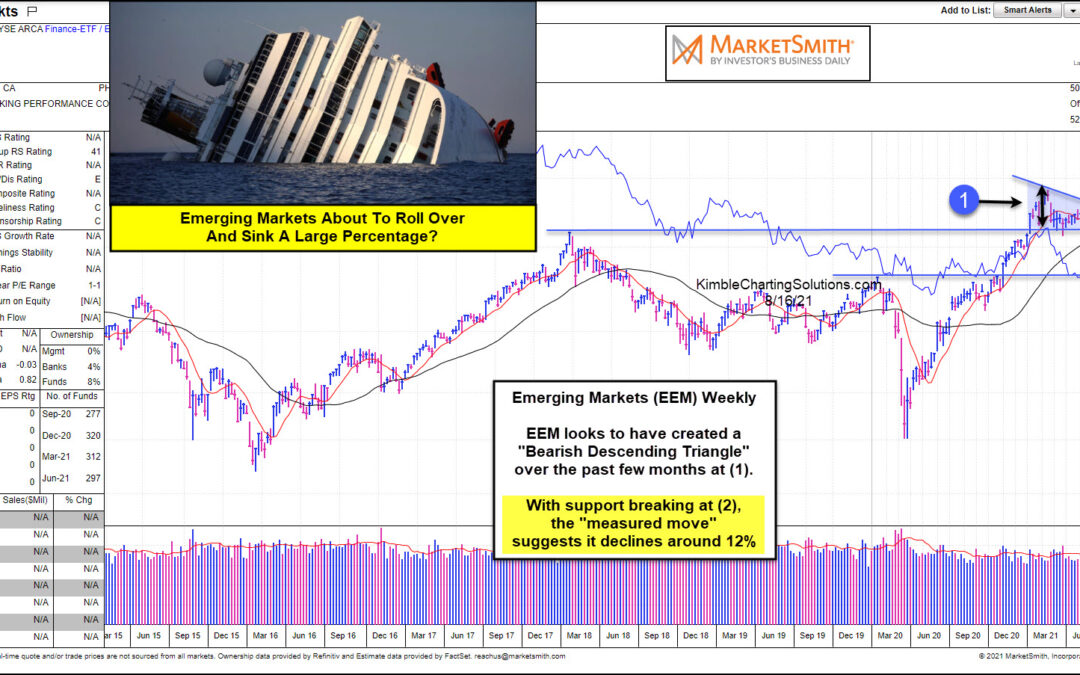
While most developed stock market indexes have been heading higher in 2021, the Emerging Markets ETF (EEM) has been trading sideways to lower. The year started off with a bang for $EEM as the ETF made new highs into February before stumbling for the next 7 months....
by Chris Kimble | Mar 15, 2021 | Kimble Charting
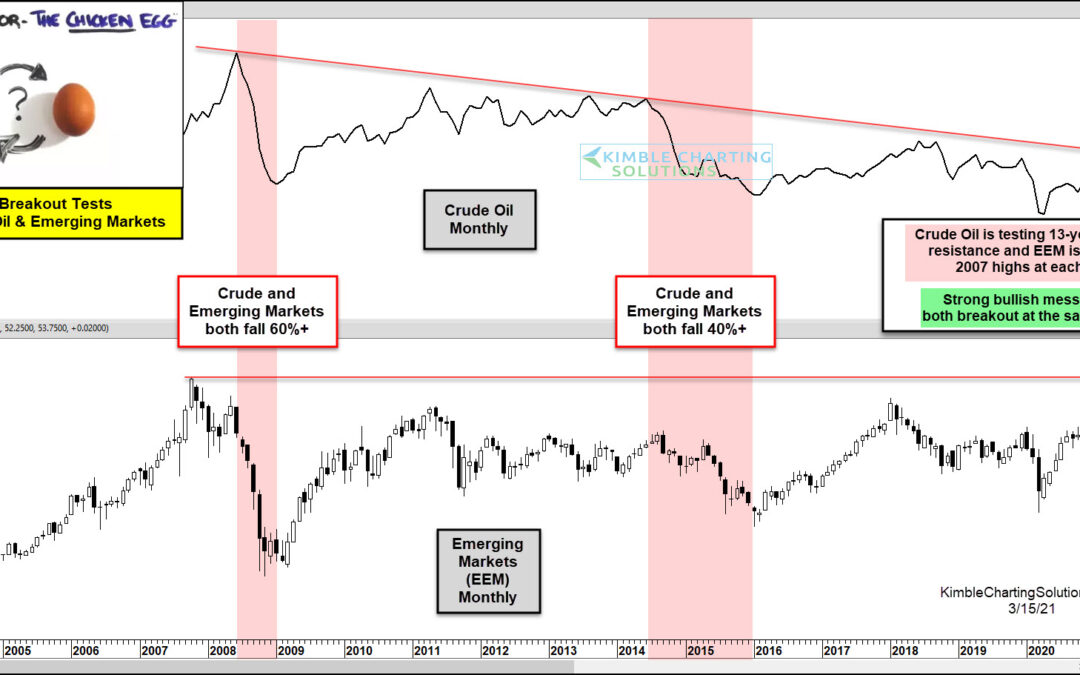
Crude Oil and Emerging Markets have experienced several important highs and lows near the same time over the past 20-years. Both peaked at the same time in 2008 and each declined over 60%. They both peaked again in 2014 and declined over 40% each. Crude oil is testing...
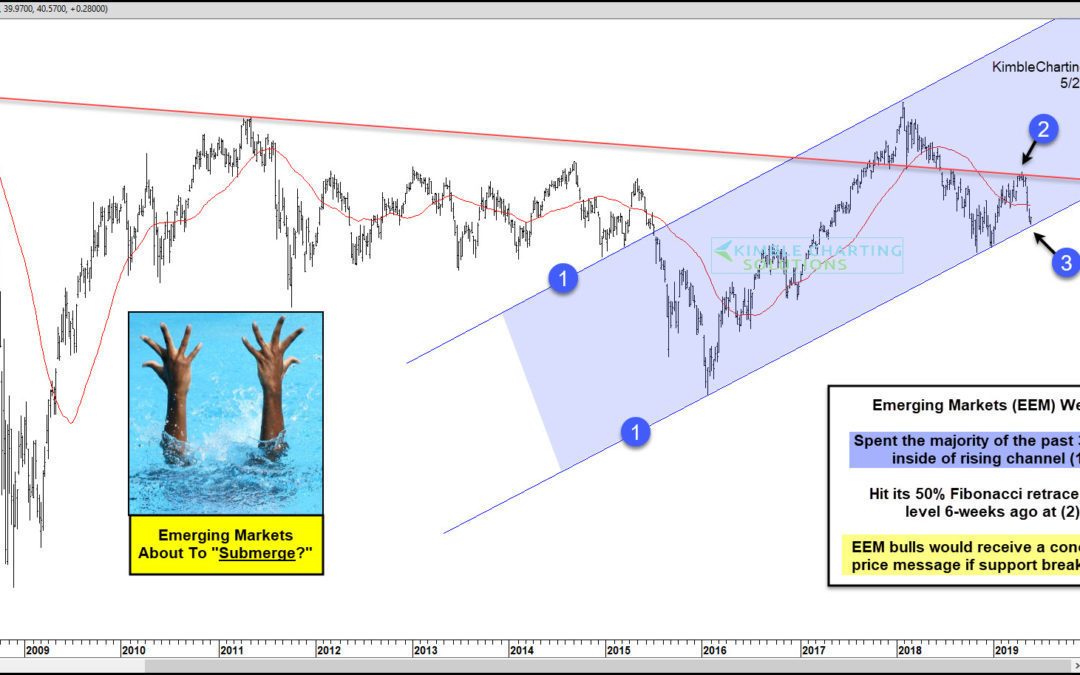
by Chris Kimble | May 22, 2019 | Kimble Charting
Are Emerging Markets about to “Submerge” and head a good deal lower? What they do at (3) will go a long way in answering this question! Emerging Markets ETF (EEM) has been lagging the broad market for the past 15-months. They hit their 50% retracement...
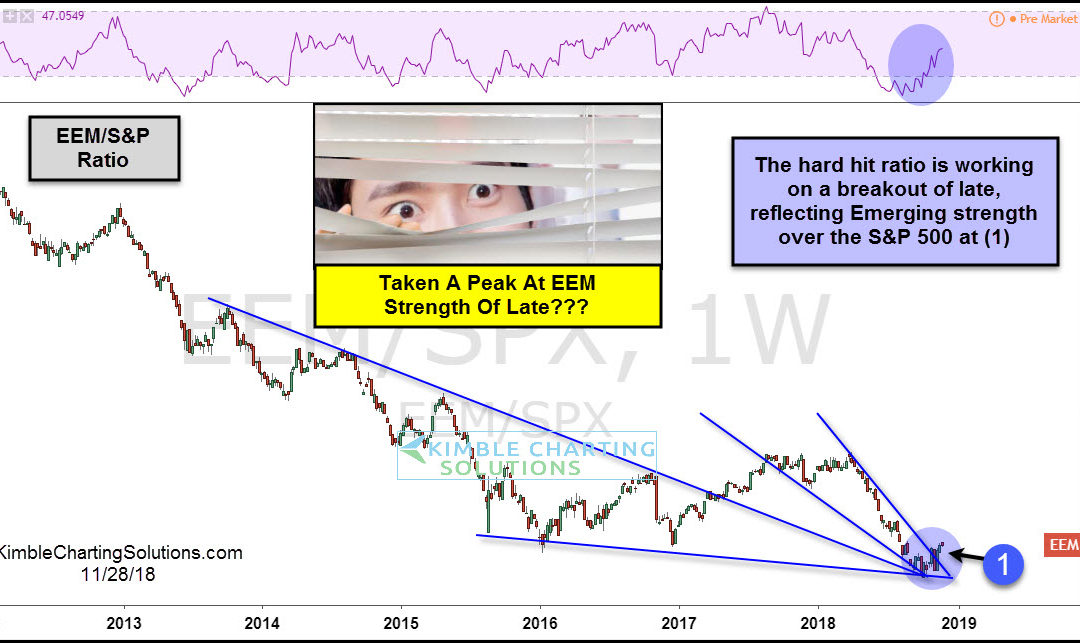
by Chris Kimble | Nov 28, 2018 | Kimble Charting
This chart looks at the Emerging Markets ETF (EEM)/S&P 500 ratio over the past 6-years. The decline in the ratio reflects EEM has been much weaker than the S&P 500 since 2012. A couple of months ago the ratio tested triple support as momentum was hitting the...
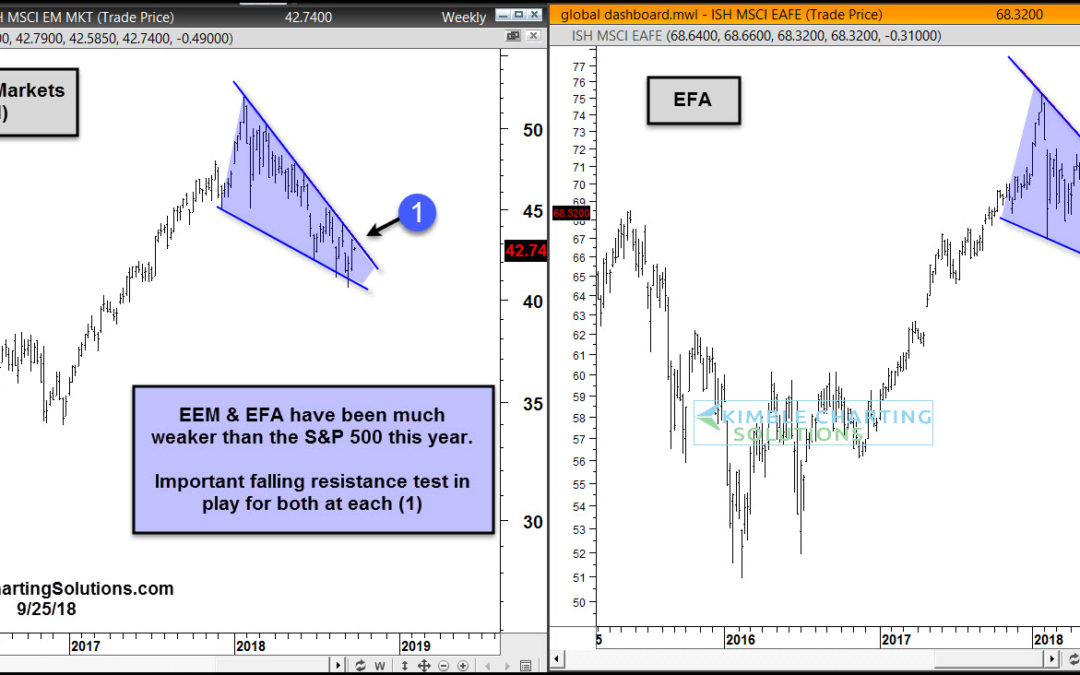
by Chris Kimble | Sep 26, 2018 | Kimble Charting
While most global stocks topped at the beginning of 2018, some markets recovered… and some did not. For instance, the major U.S. stock market indexes have fought back to make new highs, while Emerging Markets and Developed markets outside the U.S. continued to...

by Chris Kimble | Feb 8, 2018 | Kimble Charting
Stocks in the states have done well the past few years and so have stocks in Emerging Markets countries and China Below looks at popular Emerging Markets ETF (EEM) and China ETF (FXI) over the past 10-years- CLICK ON CHART TO ENLARGE EEM & FXI have both done...
