by Chris Kimble | Apr 22, 2024 | Kimble Charting
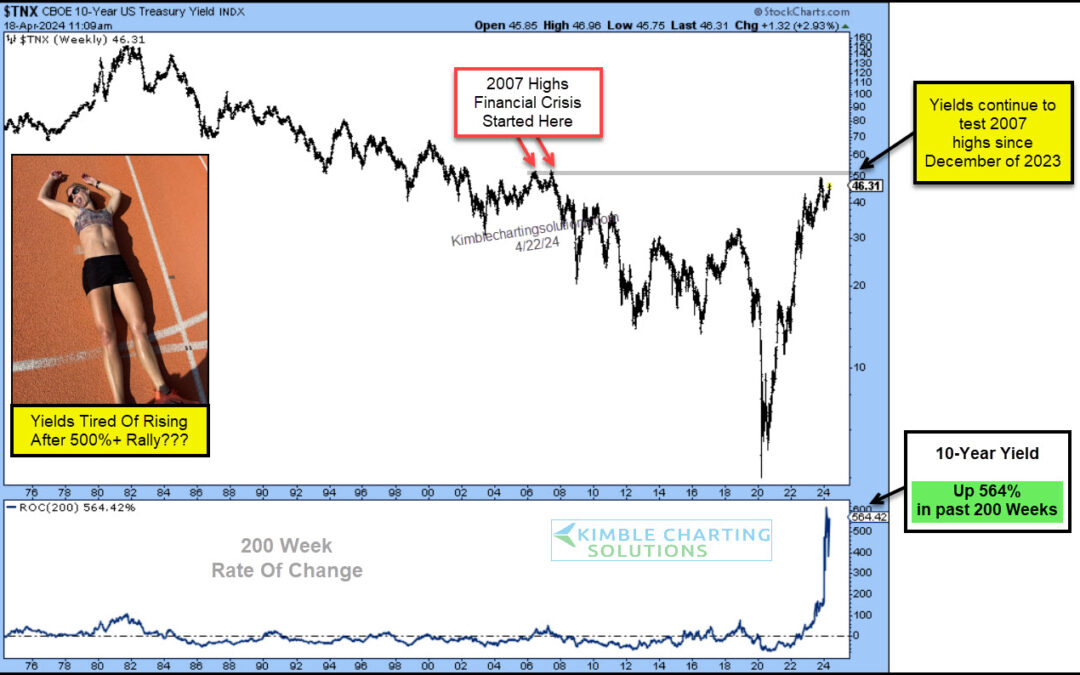
US Treasury bond yields have been moving higher for the past 4 years. Furthermore, the rally marks the largest 200-week rally in 10-year yield history. Wow! So today, we ask, are yields tired after this big run-up? Is it time for a pullback? Today’s chart highlights...
by Chris Kimble | Mar 19, 2024 | Kimble Charting
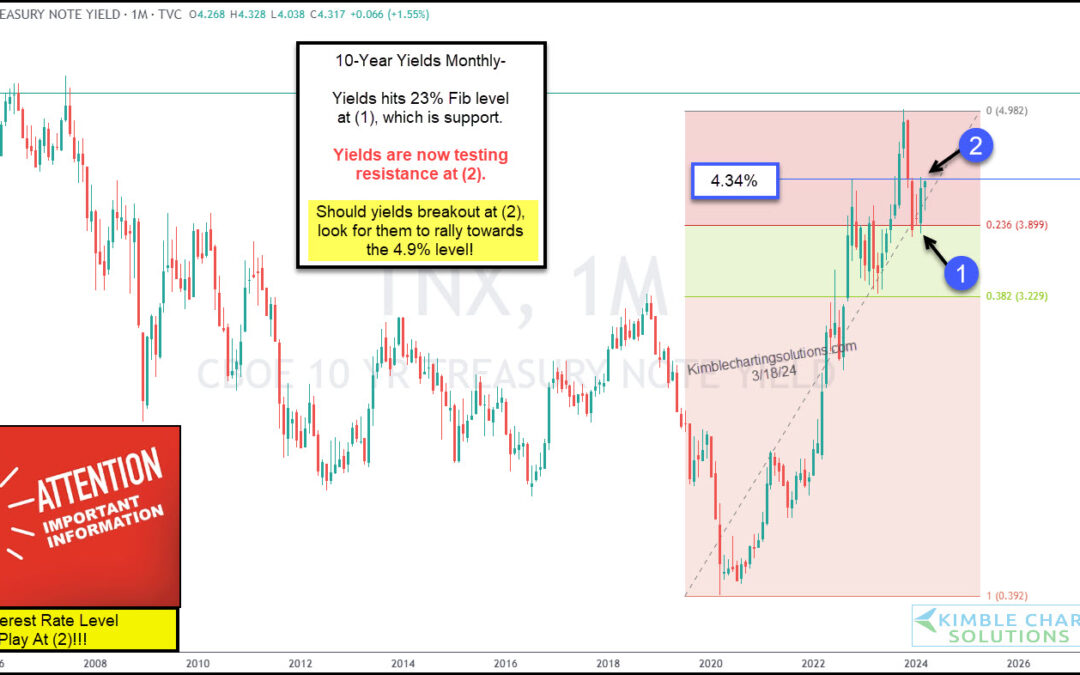
The 10-year treasury bond yield is very closely watched by banks, consumers, and active investors. It is used as a measuring stick for interest rates on loans, bond auctions, etc. When the 10-year treasury bond yield goes higher, so do interest rates on mortgages,...
by Chris Kimble | Jan 11, 2024 | Kimble Charting
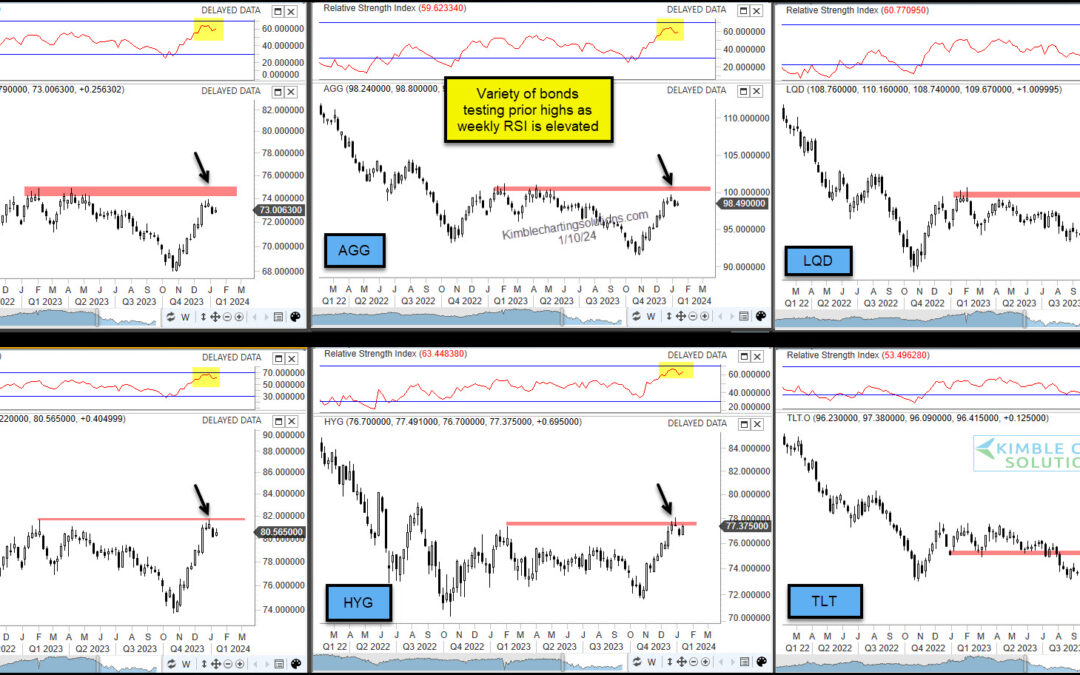
When interest rates fall, bond prices rise. And while it has been some time since we’ve been able to say interest rates are dropping, the past few months have done just that. The pullback in interest rates is coinciding with investors optimism that the Federal Reserve...
by Chris Kimble | Oct 12, 2023 | Kimble Charting
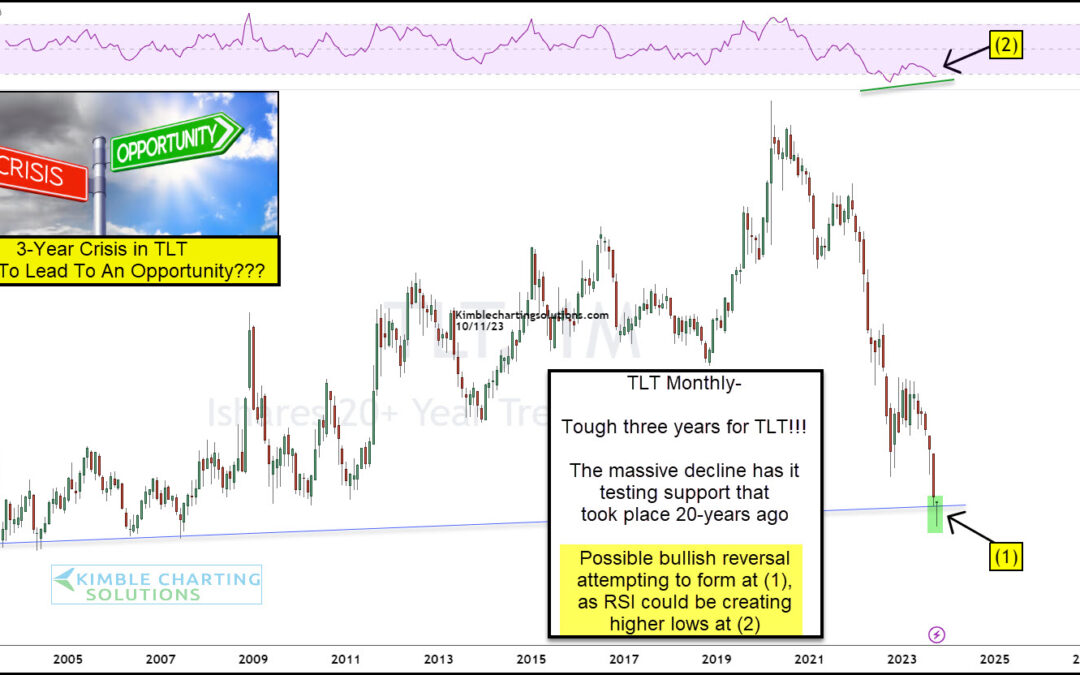
Rising interest rates has created a decline in treasury bonds not seen in modern times. Well, they say crisis equals opportunity. This may be the case today as we look at a long-term “monthly” chart of the 20+ Year Treasury Bond ETF (TLT). As you an see, it has been a...
by Chris Kimble | Sep 22, 2023 | Kimble Charting
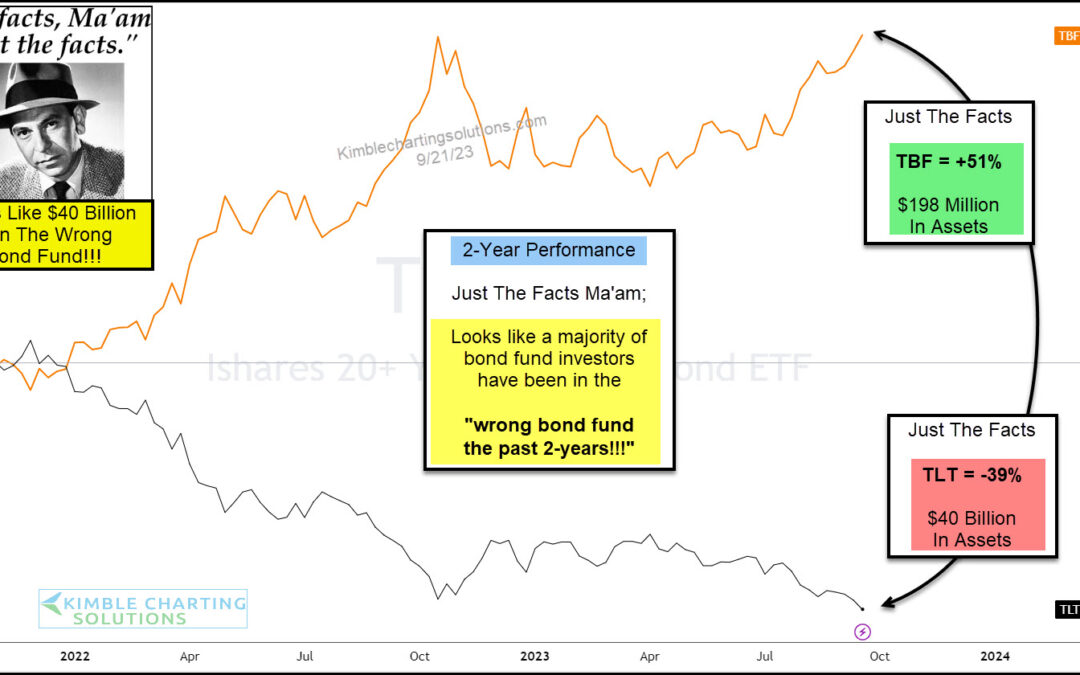
When treasury bond yields are rising, bond prices are falling. It’s an inverse relationship. And so it makes sense that the 20+ Year Treasury Bond ETF (TLT) has fallen sharply during the Federal Reserve’s rate hike cycle. “The Facts, Ma’am. Just the facts.” – Joe...
by Chris Kimble | Aug 2, 2023 | Kimble Charting
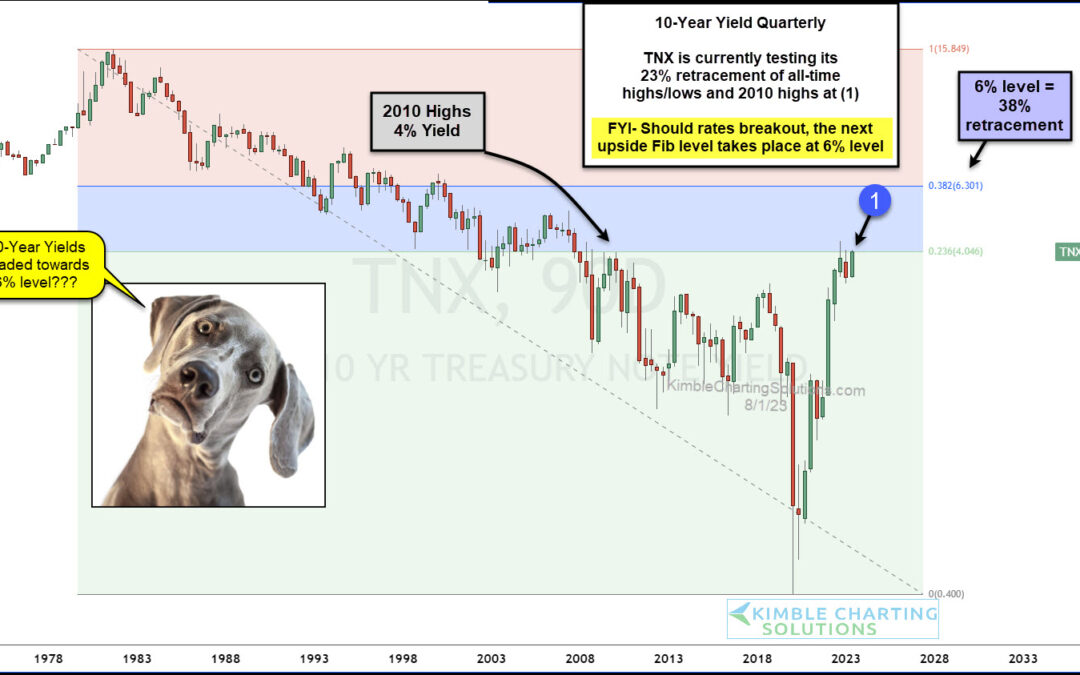
Interest rates remain in the spotlight with investors watching every economic data release and wondering when the Federal Reserve will stop raising rates. Well, one way to gauge this environment is to watch the 10-Year US Treasury bond yield. And as you guessed, it’s...
by Chris Kimble | Jun 6, 2023 | Kimble Charting
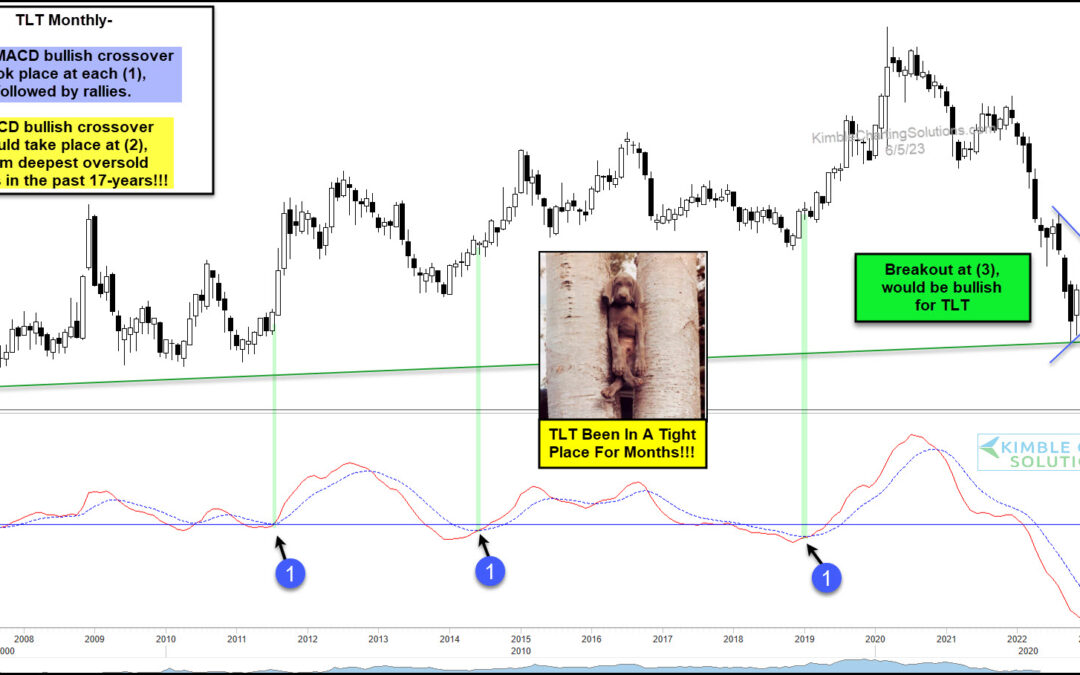
The popular treasury bonds etf (TLT) has been trading in a very tight space for months. Or better stated, it has been narrowing/tightening for months. This all comes after a precipitous 2-year decline from 2020 into 2022. Above you will find today’s long-term...
by Chris Kimble | May 5, 2023 | Kimble Charting
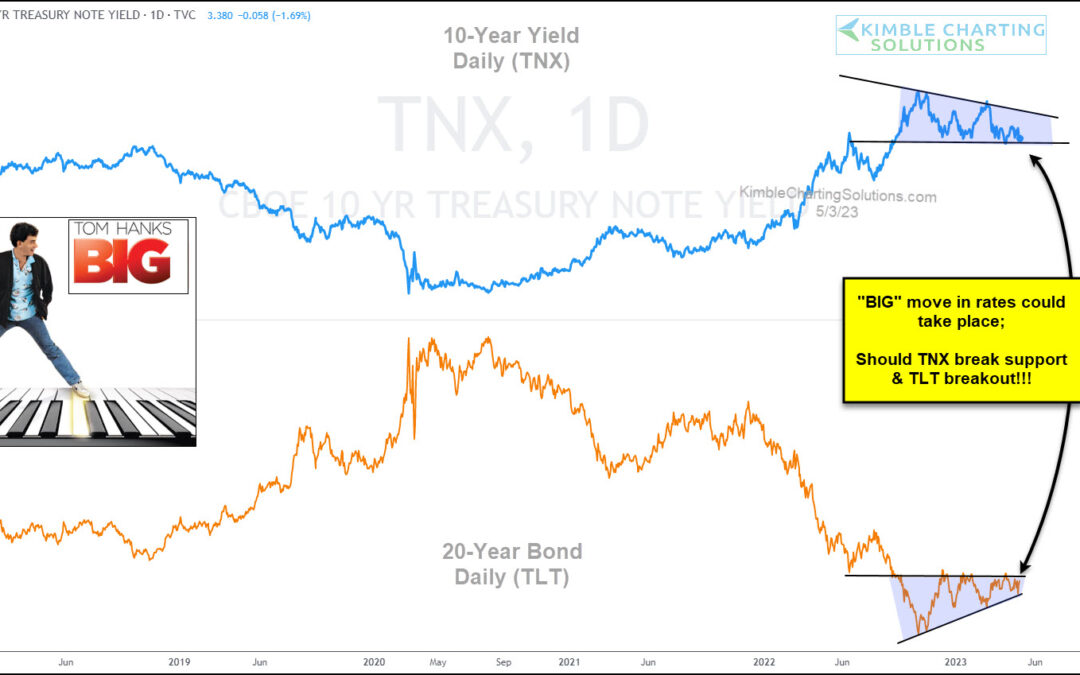
As the Federal Reserve continues to fight inflation by raising interest rates, the market is growing uncertain about futures rate hikes. Today, we share a chart comparing the 10-year US treasury bond yield versus the popular 20+ year treasury bond ETF. As you can see,...


