by Chris Kimble | Apr 5, 2024 | Kimble Charting
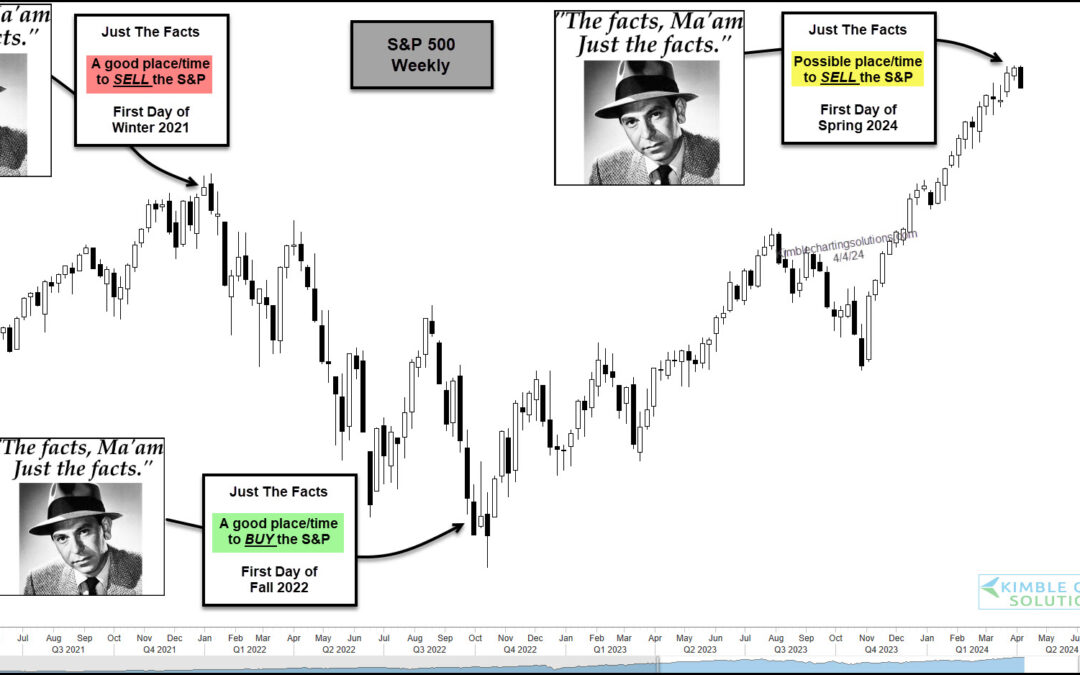
The stock market has been red hot over the past 5 months or so with both the S&P 500 and Nasdaq sporting big gains. But as we will see in today’s “weekly” chart of the S&P 500 Index, the seasonal start of Winter, Spring, Summer, and Fall can sometimes be a...
by Chris Kimble | Nov 22, 2023 | Kimble Charting
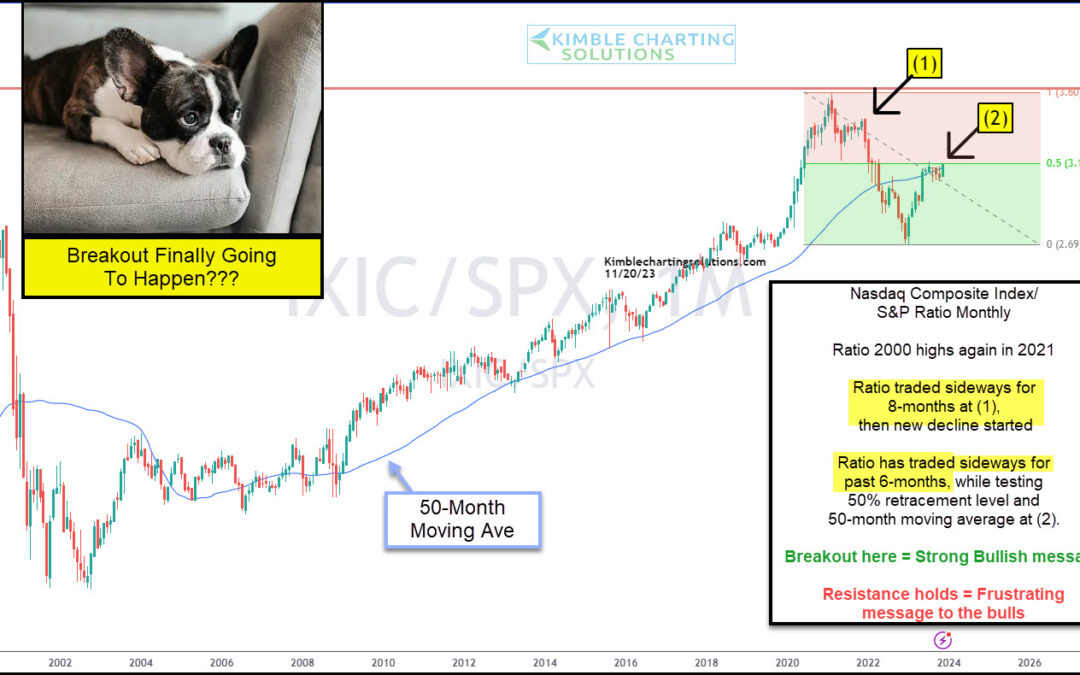
The main engine of the domestic economy and stock market indices is the technology sector. No doubt about it. Technology stocks have lead the stock market for over two decades, so it’s always worth watching the Nasdaq indices and how they are faring. Today we provide...
by Chris Kimble | Nov 21, 2023 | Kimble Charting
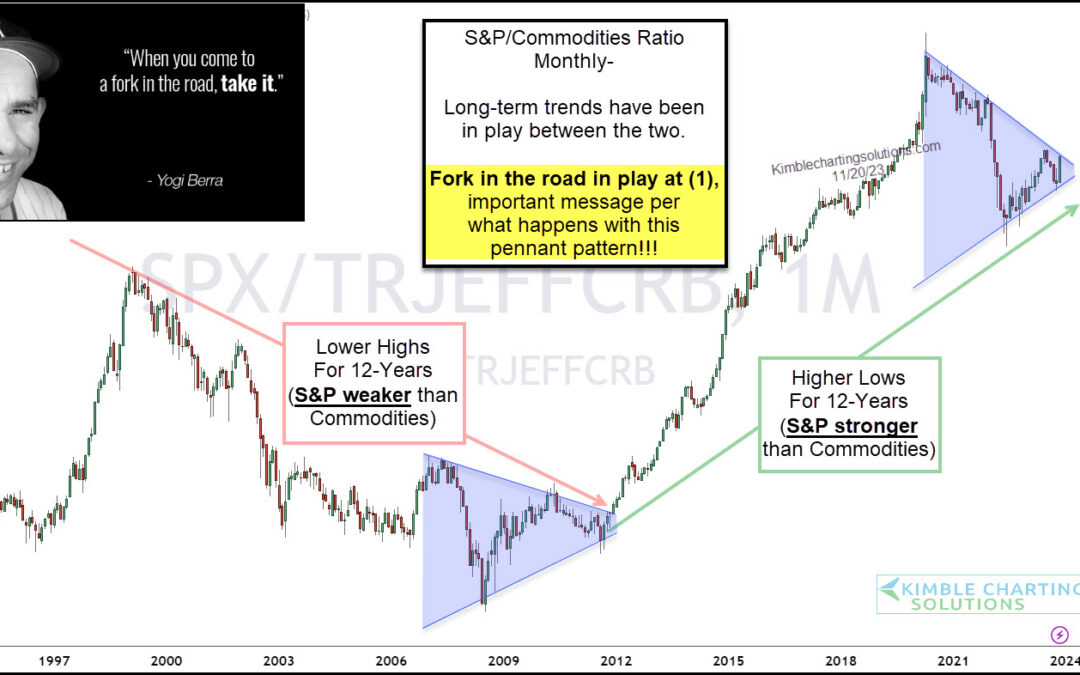
Who says cycles don’t exist? Today, we put cycles on full display in looking at the performance of two of the most important asset classes: Equities and Commodities. The chart below takes a long-term “monthly” view of the performance ratio of the S&P 500...
by Chris Kimble | Oct 30, 2023 | Kimble Charting
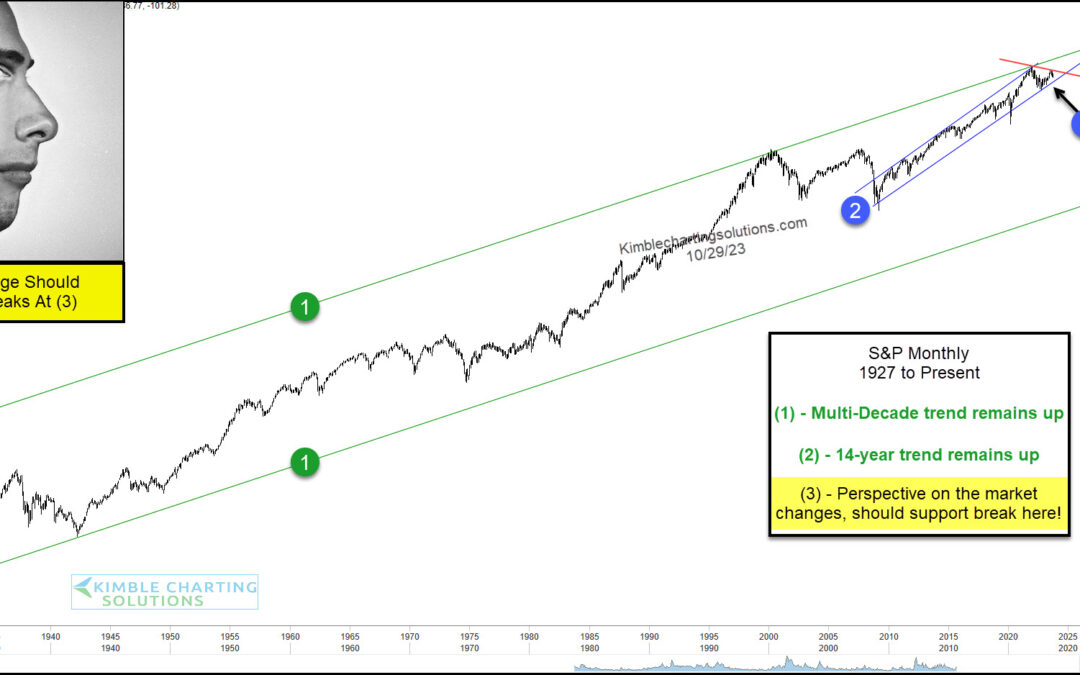
Stocks have come under pressure and concerns are beginning to mount. But rather than zooming in on the short-term, sometimes it’s good to zoom out and look at the long-term technical picture. And in today’s case, it may very well lead us to the short-term outcome as...
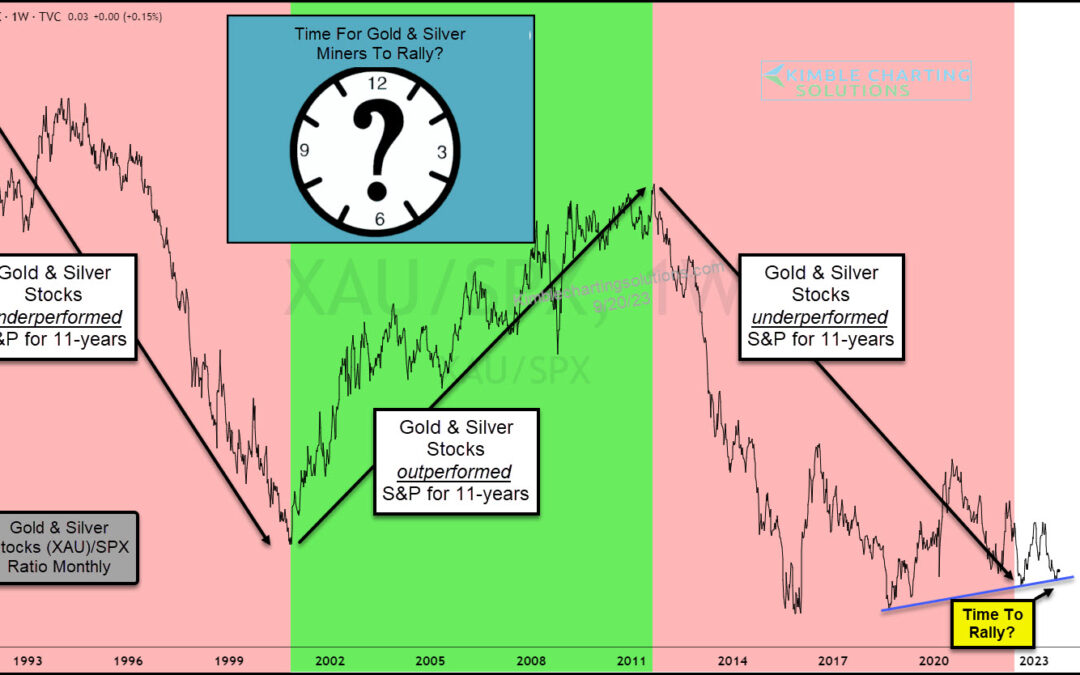
by Chris Kimble | Sep 20, 2023 | Kimble Charting
The price of gold is trading just off its all-time highs while the price of silver is lagging. Together, they haven’t quite provided mining equities the boost they need to out-perform the broad market. But an 11-year cycle may be saying that gold and silver mining...
by Chris Kimble | Sep 13, 2023 | Kimble Charting
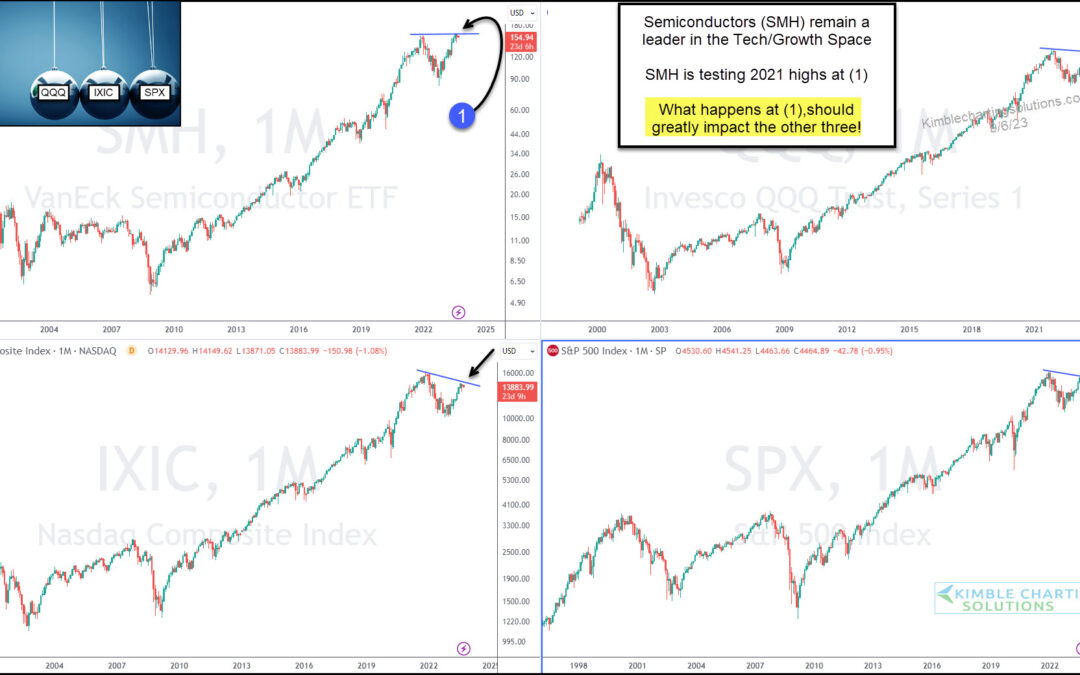
Without a doubt, technology stocks are the leader within global stock markets and the global economy. So when the technology sector nears a major trend decision point, investors and consumers should be watching! And that is exactly what we have on display today, as...
by Chris Kimble | Sep 8, 2023 | Kimble Charting
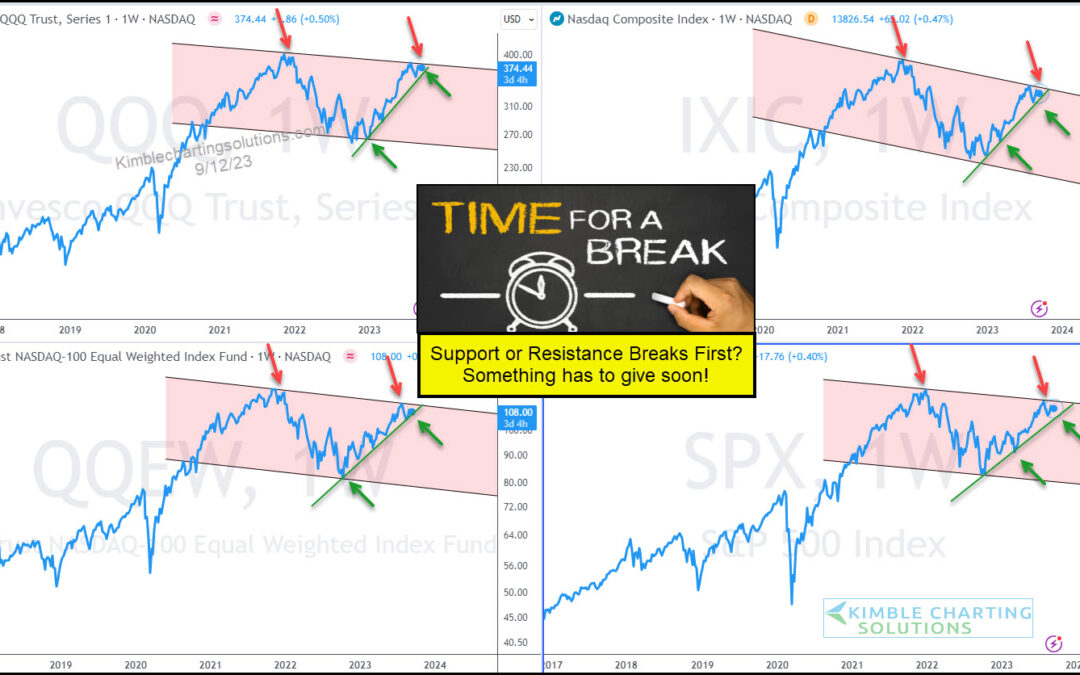
The stock market appears to be limping its way through the final stages of its rally. The major stock market indices have yet to make new highs and are in stall-out mode. A bit concerning, eh? These concerns are on full display in today’s chart 4-pack. As you can see,...
by Chris Kimble | Jan 5, 2022 | Kimble Charting
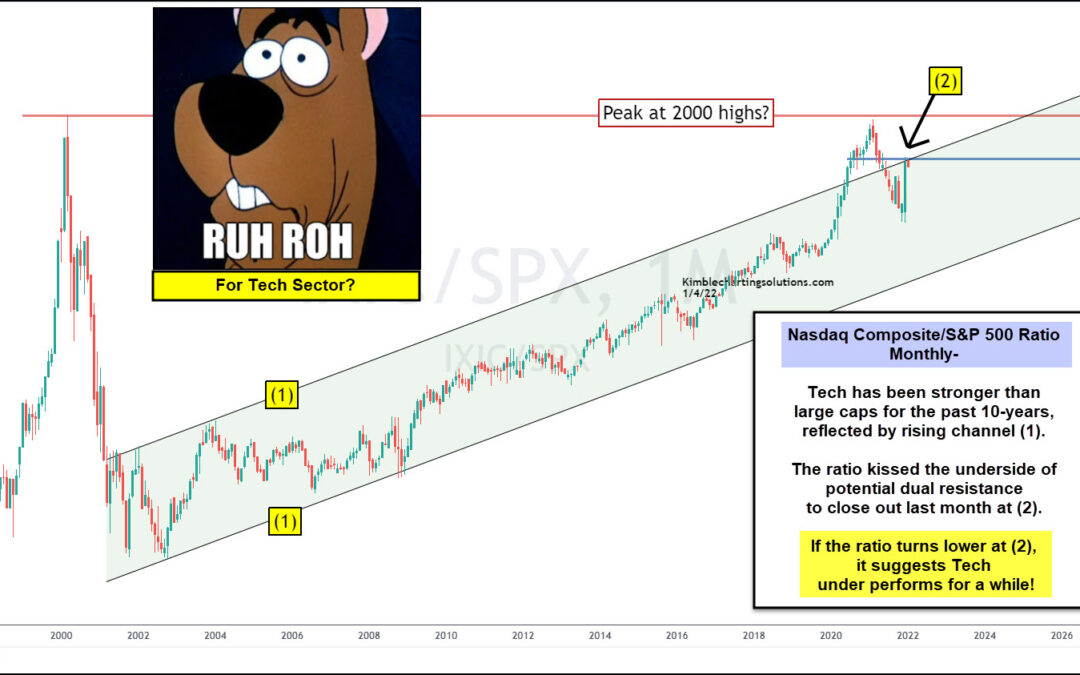
Tech stocks began under-performing the broader market several months ago when the ratio of the Nasdaq Composite to S&P 500 Index peaked out at the 2000 high. This is worth noting because this tech ratio has been in a rising up-trend for the past two decades,...
