by Chris Kimble | Jul 19, 2024 | Kimble Charting
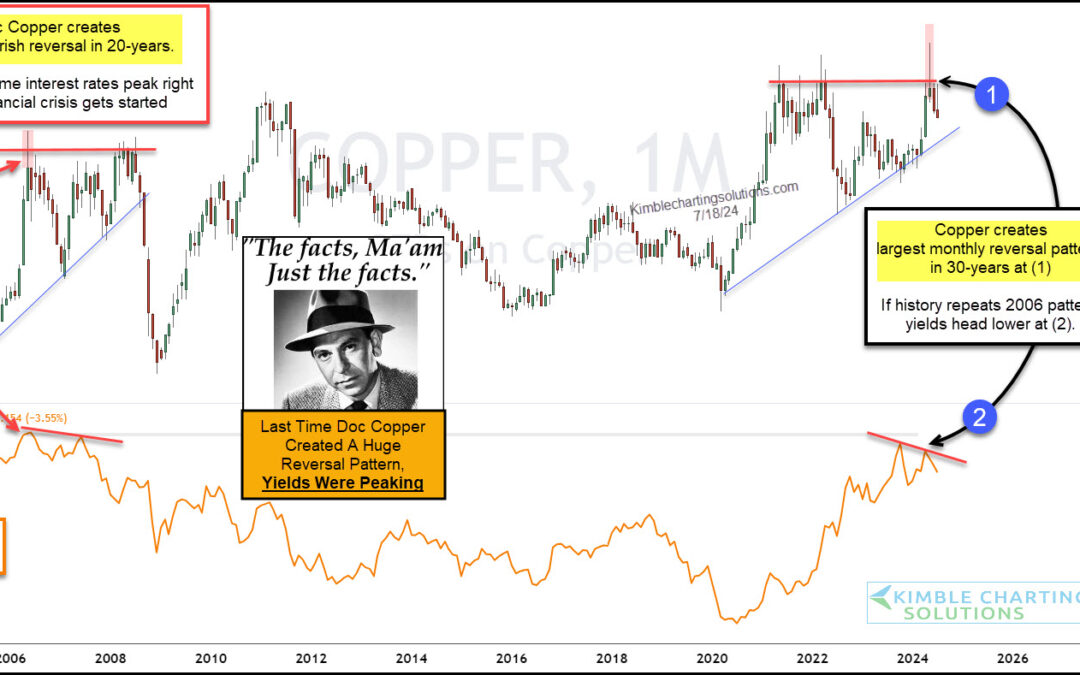
Investors have been watching the Federal Reserve and interest rates closely for the past several months. Well, actually more like the past several years. But maybe they should be watching copper prices for clues on where interest rates are headed. “The facts, Ma’am....
by Chris Kimble | Jan 17, 2024 | Kimble Charting
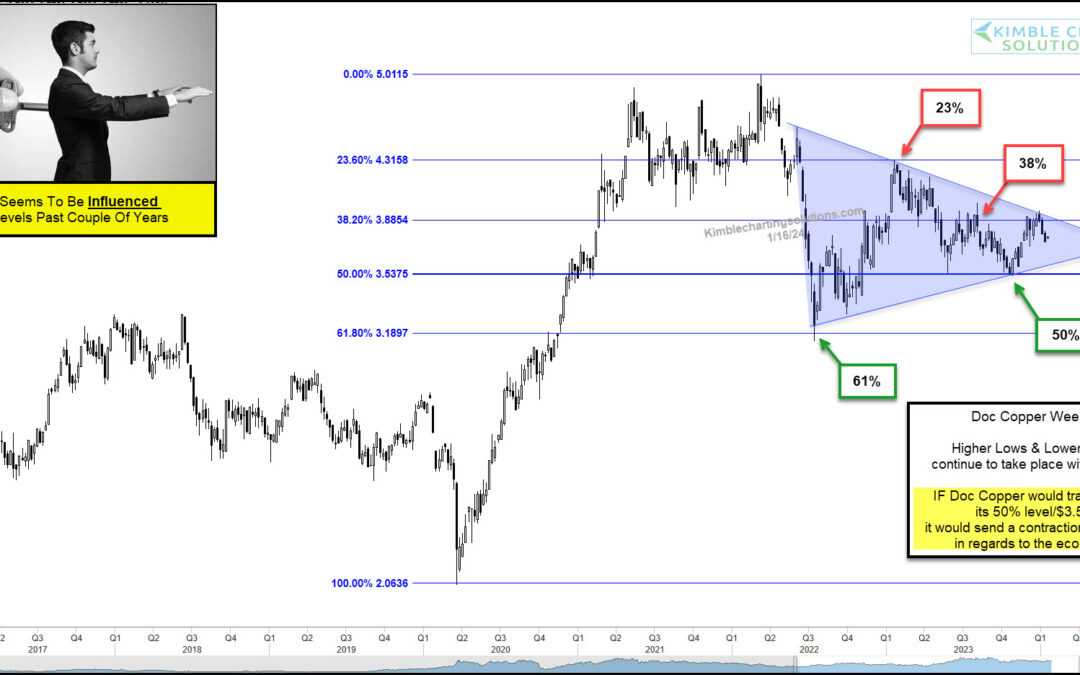
After peaking in 2021, copper prices declined sharply before bouncing around for a few years. That “bouncing” ended up following the twists and turns of Fibonacci rules. And we can see this in today’s “weekly” chart of Copper. Yes, Doc Copper seems to be under the...
by Chris Kimble | Aug 15, 2023 | Kimble Charting
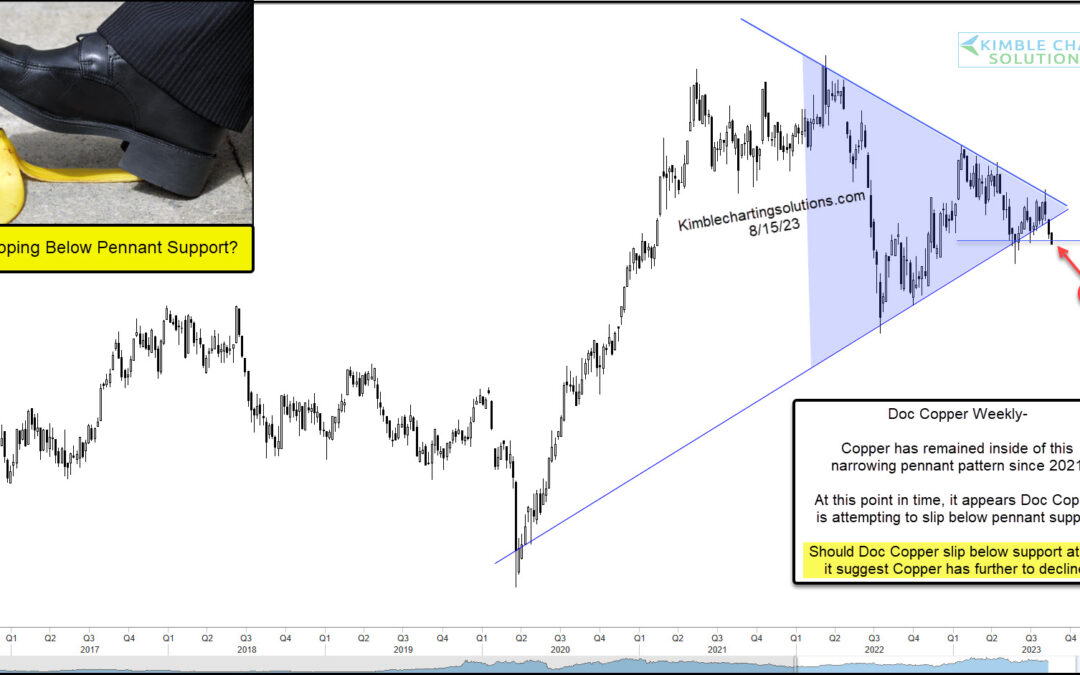
Although copper isn’t the economic bellwether that it was 50 years ago, it is still an important barometer of economic activity. As you can see in today’s chart, Copper fell sharply into the 2020 coronavirus crash before racing higher and rallying just as sharply with...
by Chris Kimble | May 15, 2023 | Kimble Charting
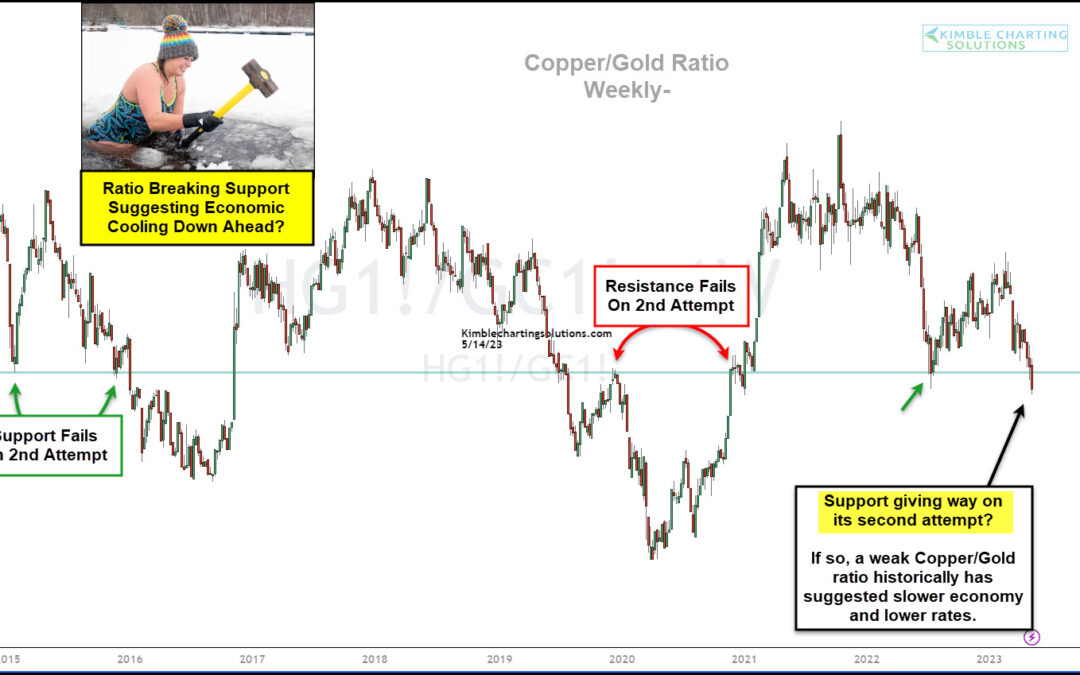
The world is full of economic concerns. Inflation, economic slowdown, global trade, and international war. So what’s next? Today’s chart might just might share a glimpse into the future. Below is a “weekly” chart of the Copper to Gold price ratio. Typically, when this...
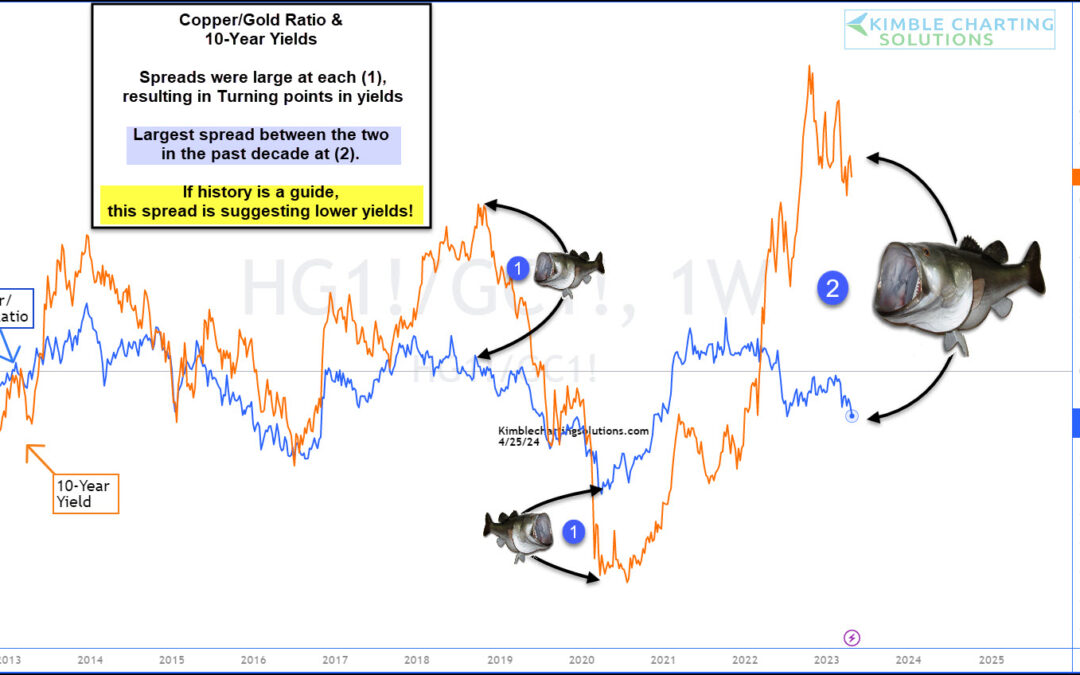
by Chris Kimble | Apr 26, 2023 | Kimble Charting
The past two years have seen headlines dogged by inflation and the Federal Reserve’s fight to end inflation. That fight has seen the Federal Reserve raise interest rates over and over again… and 10-year treasury bond yields have followed suit and risen sharply. One...
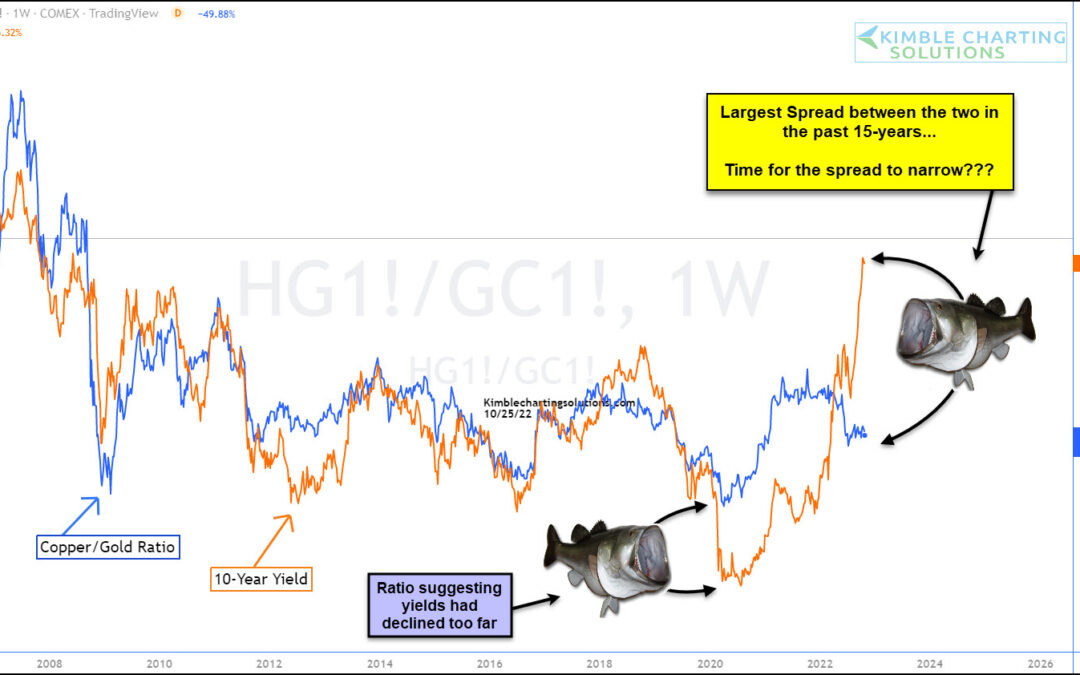
by Chris Kimble | Oct 26, 2022 | Kimble Charting
The price of copper to gold has been a correlation that has followed 10-Year US Treasury bond yields (in trend) fairly closely. This correlation has been one that I’ve followed to see if bond yields are changing trend, or if the trend has become overdone. Today, this...
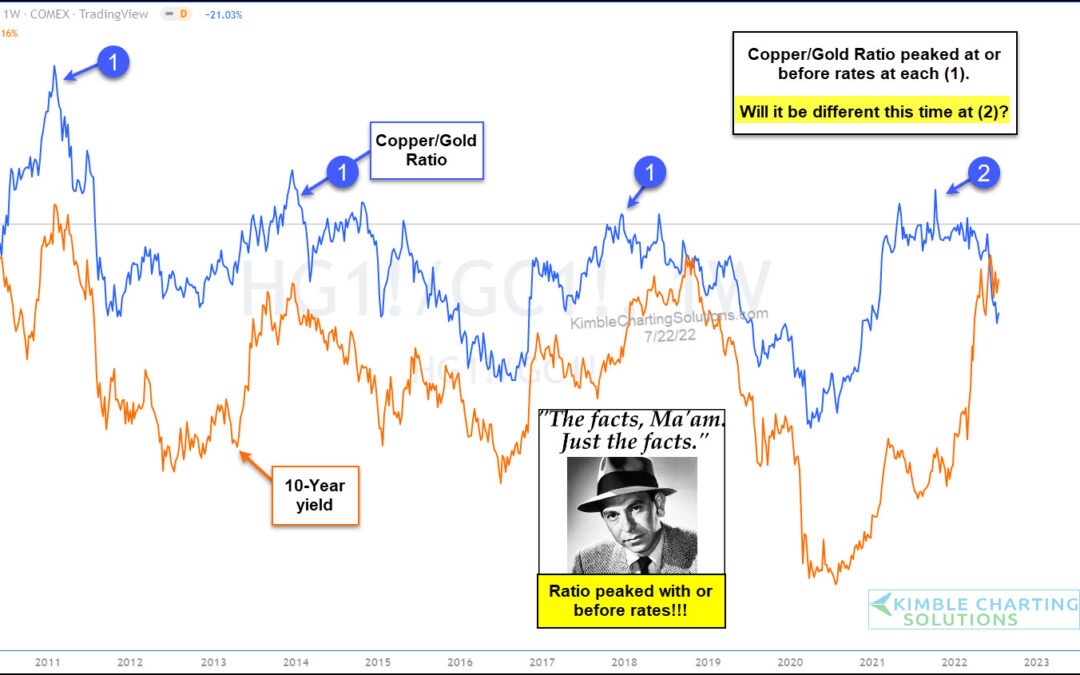
by Chris Kimble | Jul 22, 2022 | Kimble Charting
One of the most important themes during the first half of 2022 is rising interest rates. And with the Federal Reserve focused on stopping inflation, it’s a legitimate concern. But is there also a case for falling interest rates in the back half of 2022? With several...
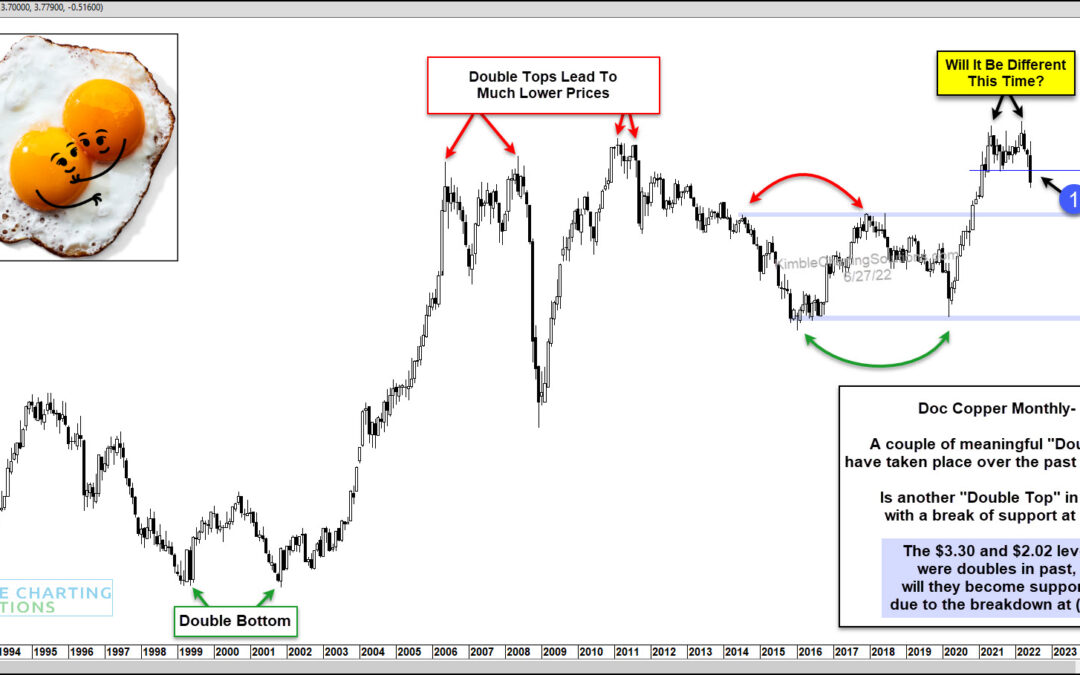
by Chris Kimble | Jun 28, 2022 | Kimble Charting
Looks like the historic run higher in copper prices may be taking a breather. While we cannot say that the LONG-term rally is over. It definitely has put in an intermediate top. Back in March, we wrote about this possibility in our article, “Is Copper Repeating...
