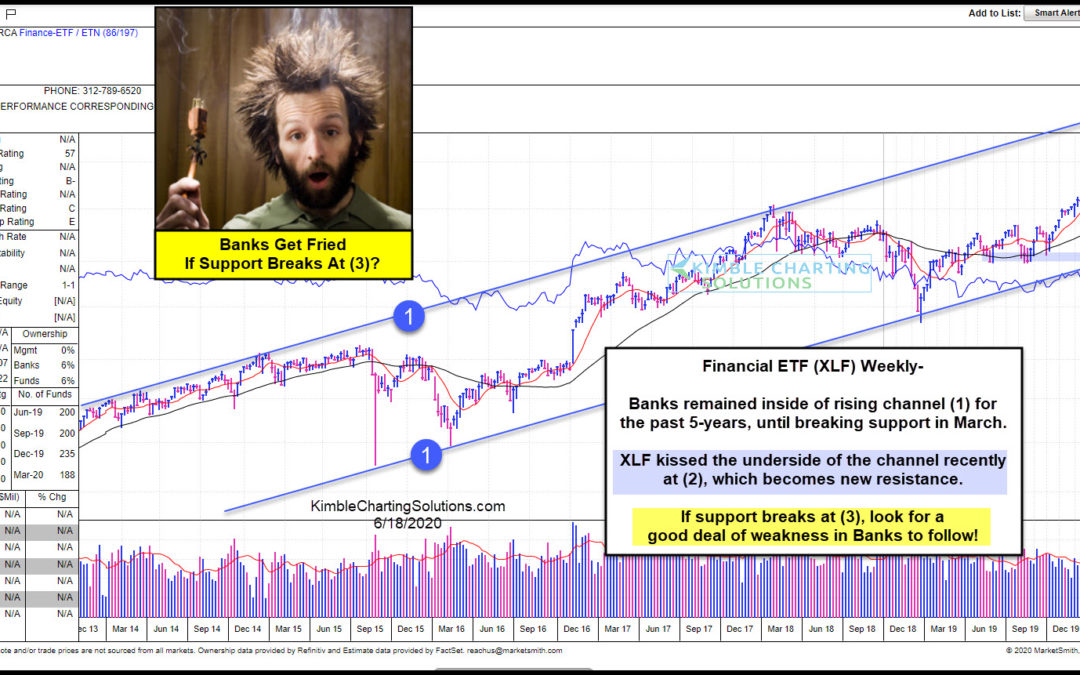
by Chris Kimble | Jun 18, 2020 | Kimble Charting
Are banks about to get fried? Sure could if current support fails to hold! This chart looks at Financial ETF (XLF) from Marketsmith.com on a weekly basis over the past 7-years. XLF has remained inside of bullish rising channel (1) for the past 5-years. Weakness took...
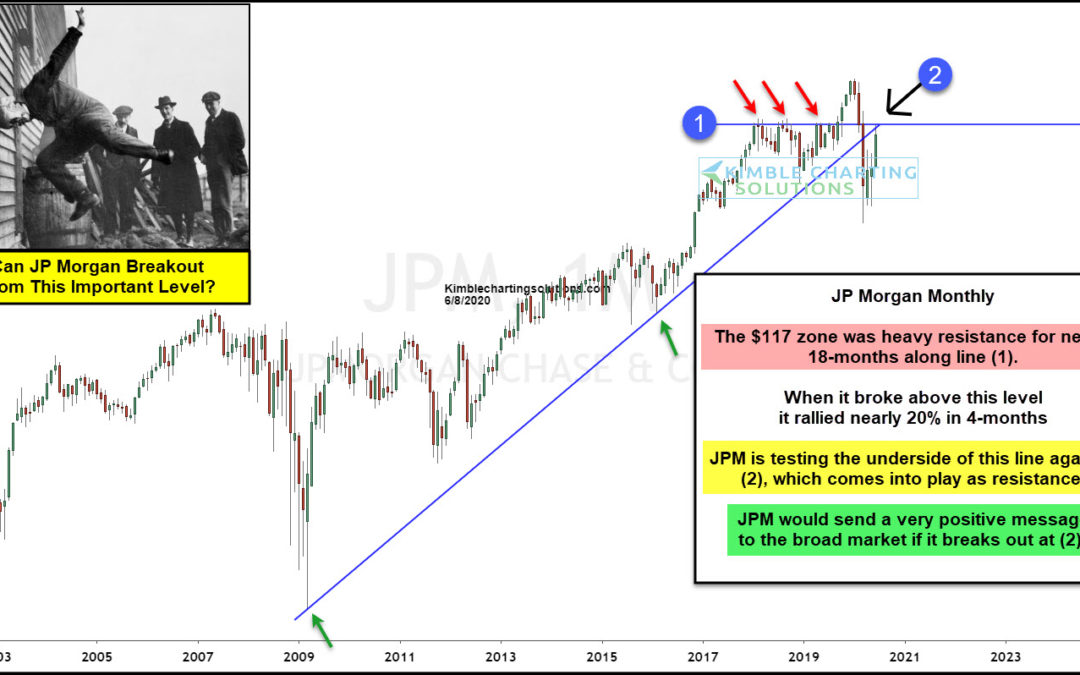
by Chris Kimble | Jun 8, 2020 | Kimble Charting
Is a major bank in the states about to send the broad market a bullish message? If it breaks out at (2), it will! JP Morgan struggled to break above resistance for nearly 18-months, as it keep kissing the underside of line (1). Once it succeeded in breaking out, it...
by Chris Kimble | Dec 9, 2019 | Kimble Charting
Just as the health of the banking sector is a big deal to the economy, it’s equally important to the S&P 500 (SPY) and broader stock market. Although the bull market has grinding higher, it’s awaiting confirmation from the banks and banks stocks. Today’s chart is...
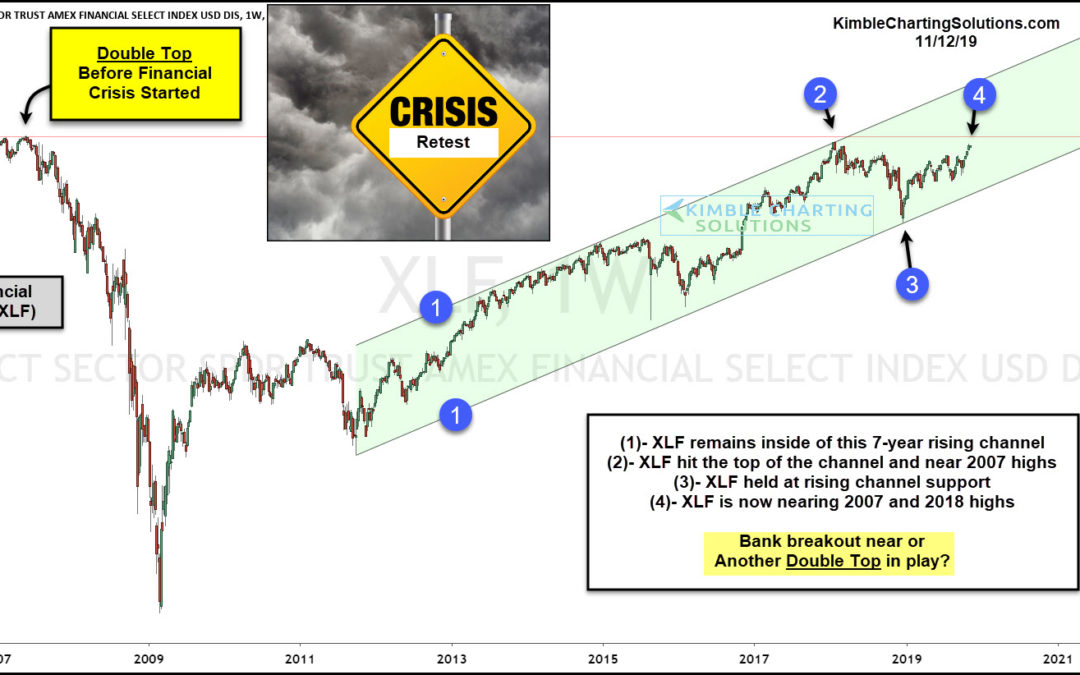
by Chris Kimble | Nov 12, 2019 | Kimble Charting
If the saying “So Goes The Banks, So Goes The Broad Market” is true, banks are facing a critical breakout/resistance test in my opinion. This chart looks at Financials ETF (XLF) over the past 12-years. This chart reflects that a double top took place prior...
by Chris Kimble | Jul 24, 2019 | Kimble Charting
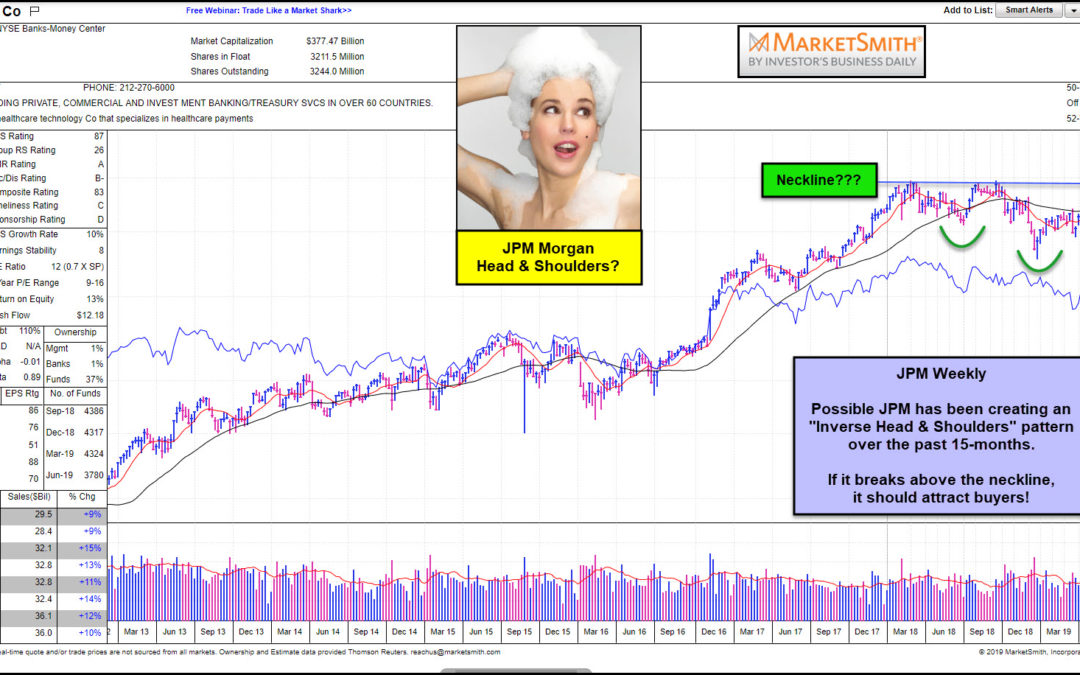
Is JP Morgan creating a pattern which is suggesting much higher prices? It could be! This chart looks at JP Morgan (JPM) on a weekly basis over the past 5-years. The chart itself comes from MarketSmith, a service provided by Investors Business Daily. Over the past...
by Chris Kimble | Jul 16, 2019 | Kimble Charting
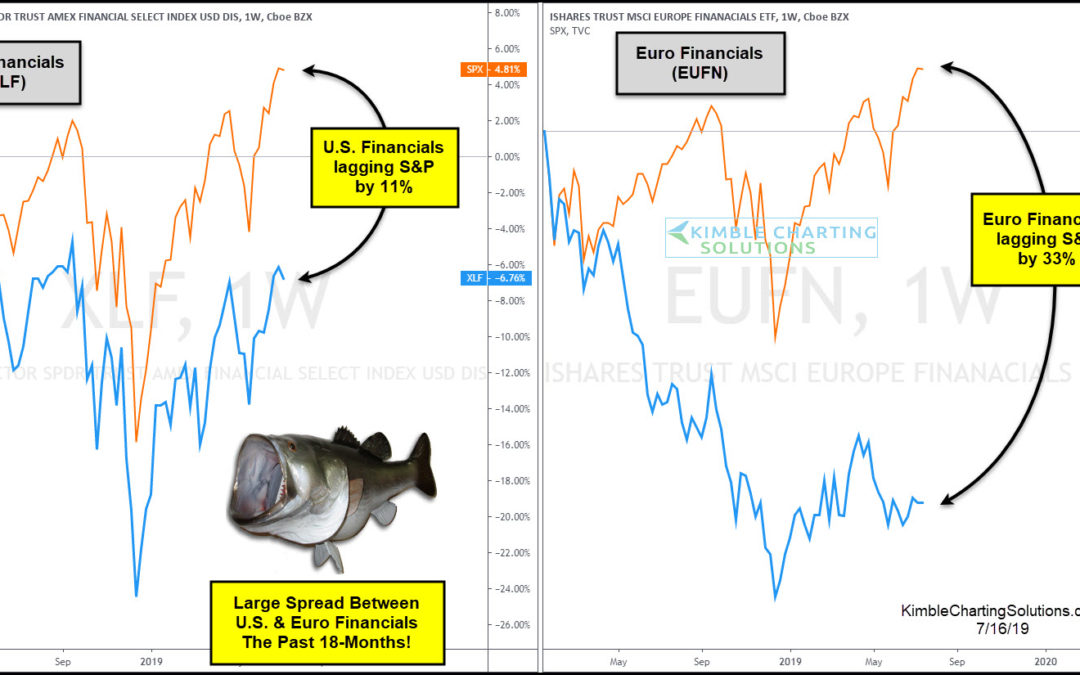
Historically its been positive to see Financials doing well at the same time the broad market is pushing higher! If financial stocks are lagging bit time, should stock bulls be concerned? This chart compares banks and in the U.S. (XLF) & Europe (EUFN) to the...
by Chris Kimble | Mar 20, 2019 | Kimble Charting
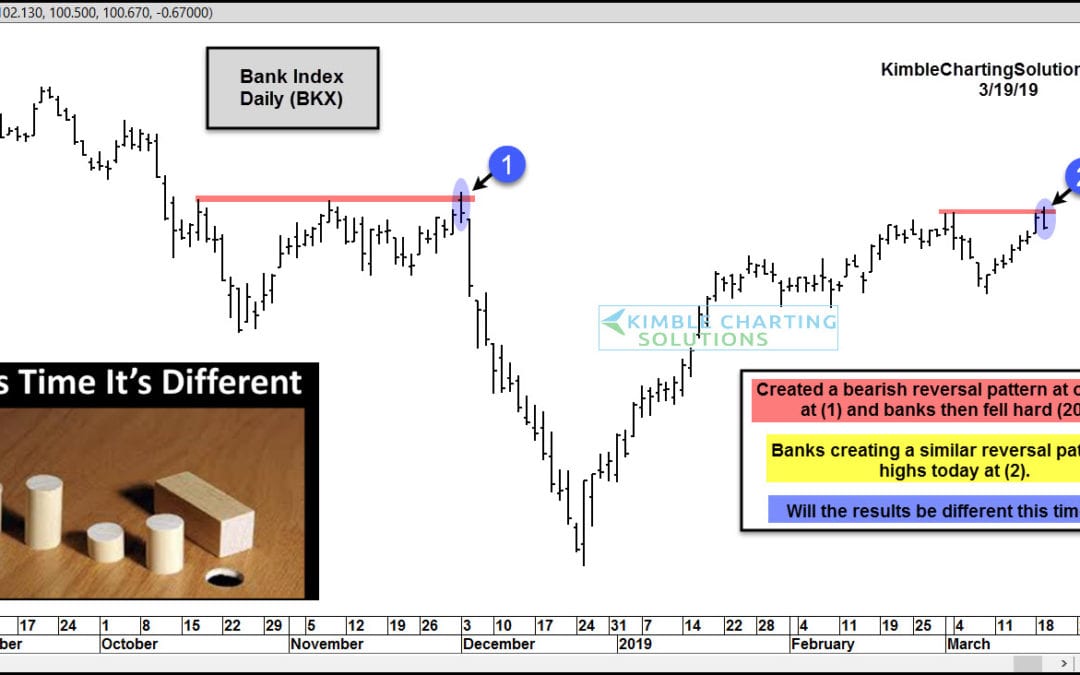
The financial / banking sector is often a good barometer of the economy and broader stock market. So when the Bank Index (BKX) began to lag late last summer, it was an early warning sign for investors. Looking at the chart below, we can see that the banks spilled...
by Chris Kimble | Mar 12, 2019 | Kimble Charting
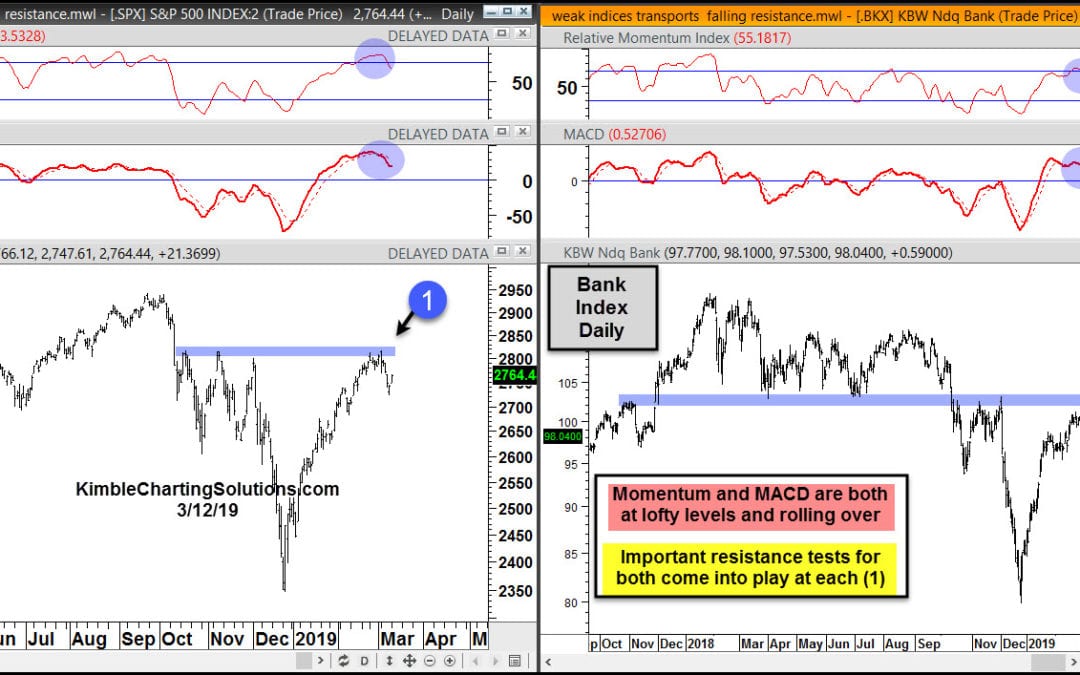
The S&P 500 pullback (last week) feels like a distant memory following the stock market’s 2-day snapback rally. But investors should take note of what’s happening under the surface for two important market indexes: the S&P 500 Index (SPX) and the Bank Index...
