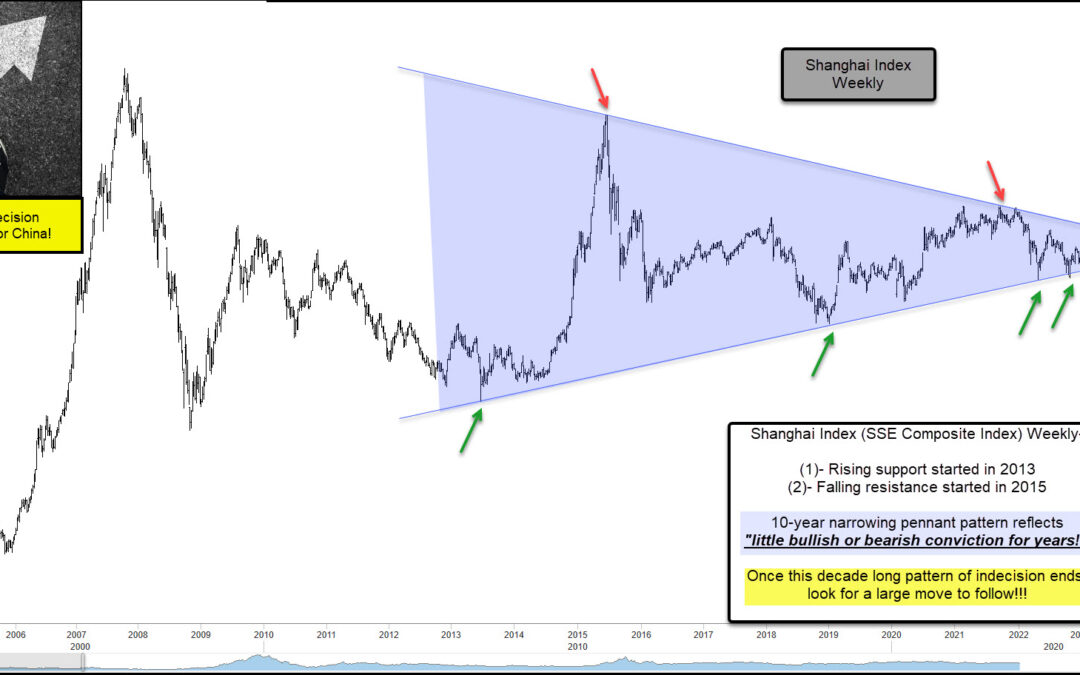
by Chris Kimble | Aug 28, 2023 | Kimble Charting
China has the world’s largest population and second largest economy, so it’s always wise to keep an eye on the Chinese economy and stock market. Today we look at the latter, eyeing up a 10-year indecision pennant pattern on the Shanghai Composite Index. As you can...
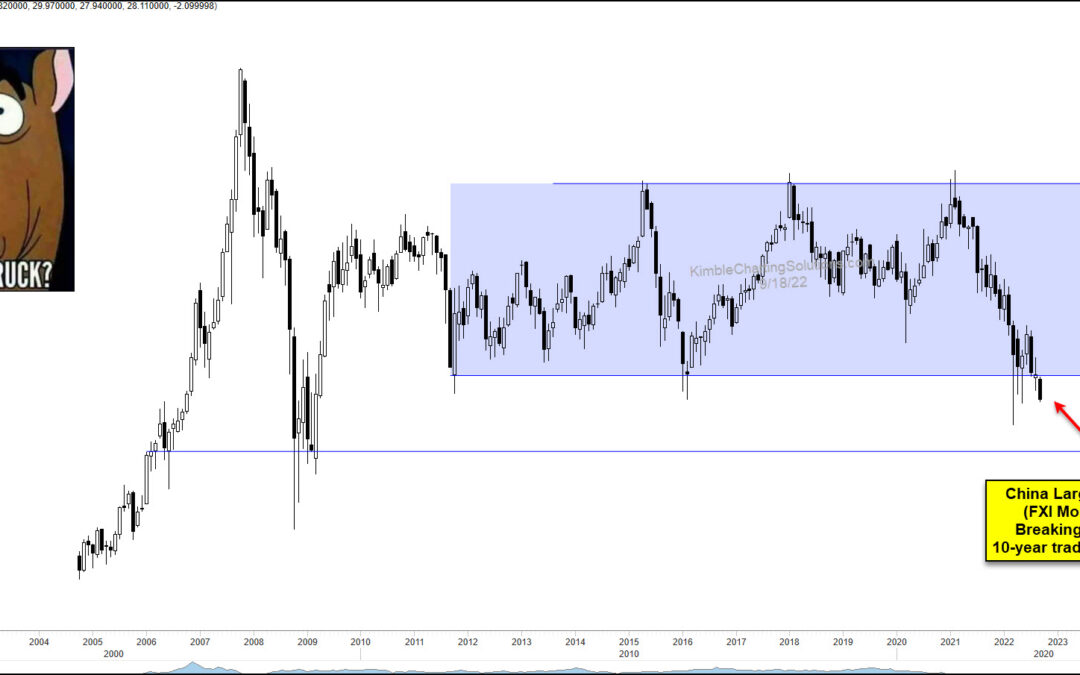
by Chris Kimble | Sep 20, 2022 | Kimble Charting
The global equities market has been in a tailspin this year. But could it get worse yet? Today we look at a very important piece of the global equities complex: China. Today’s “monthly” chart of the China large-cap ETF $FXI highlights the risk that China may be...
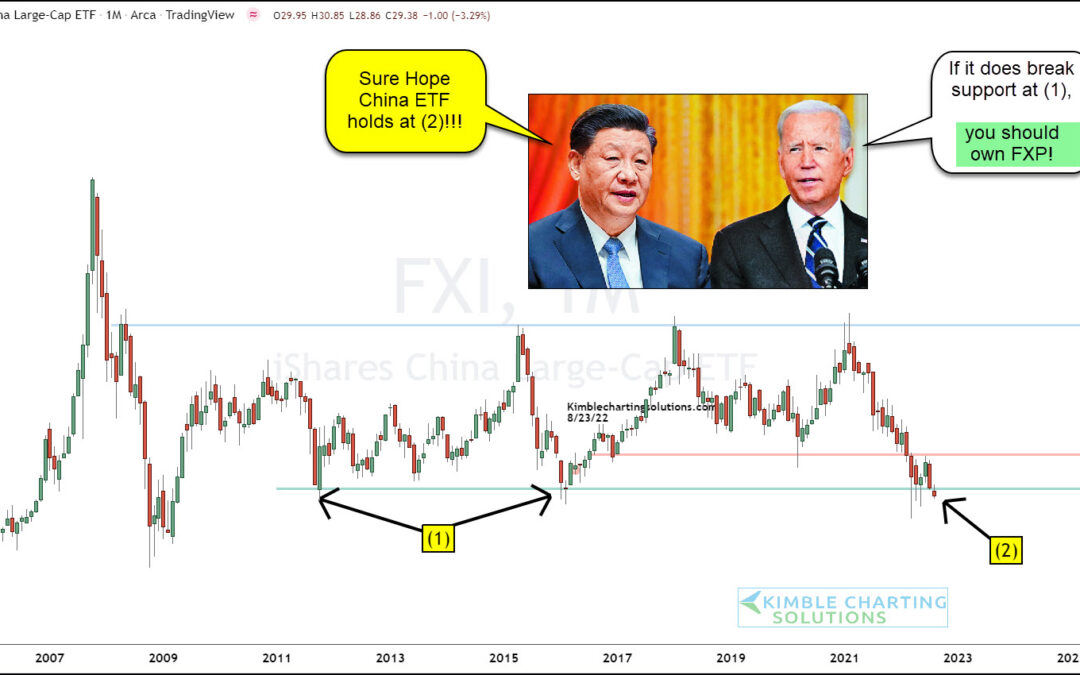
by Chris Kimble | Aug 25, 2022 | Kimble Charting
Next to the United States, one could argue that China is the world’s most important economy. It’s population and sheer size (and exports) make it a big deal to the investing community and global economy (and trade). So today we look at an important development on the...
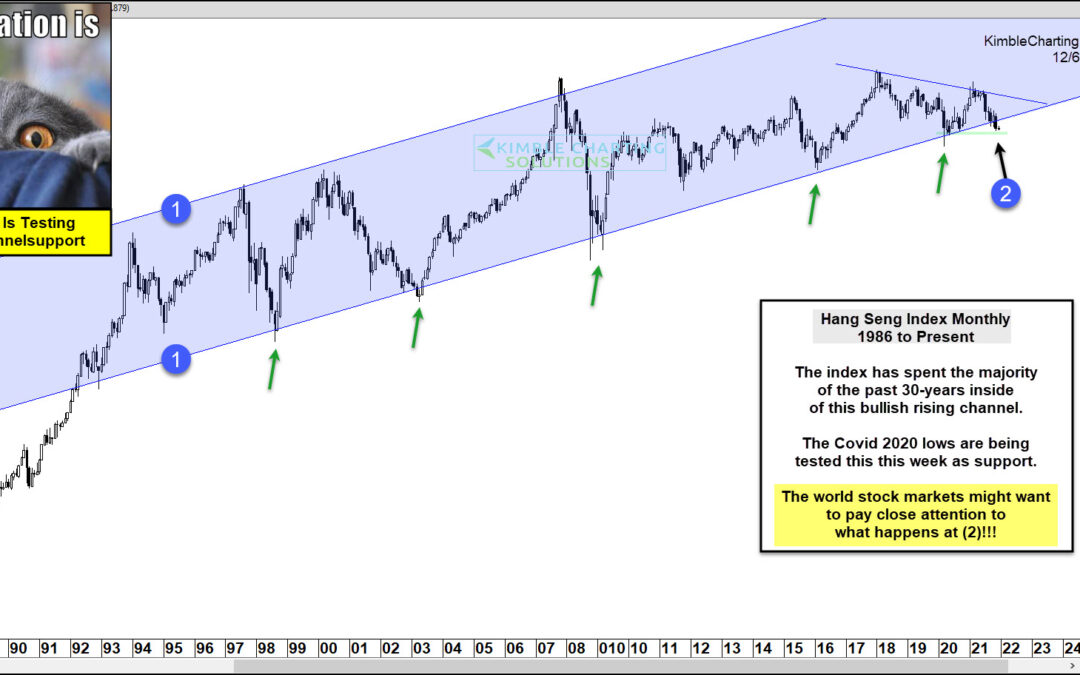
by Chris Kimble | Dec 6, 2021 | Kimble Charting
China’s rise to a global economic powerhouse has come in fits and starts. And the last 5 years would be categorized as fits. This can also be seen on the Hang Seng stock market index (Hong Kong). And should this index decline much further, global markets may throw a...
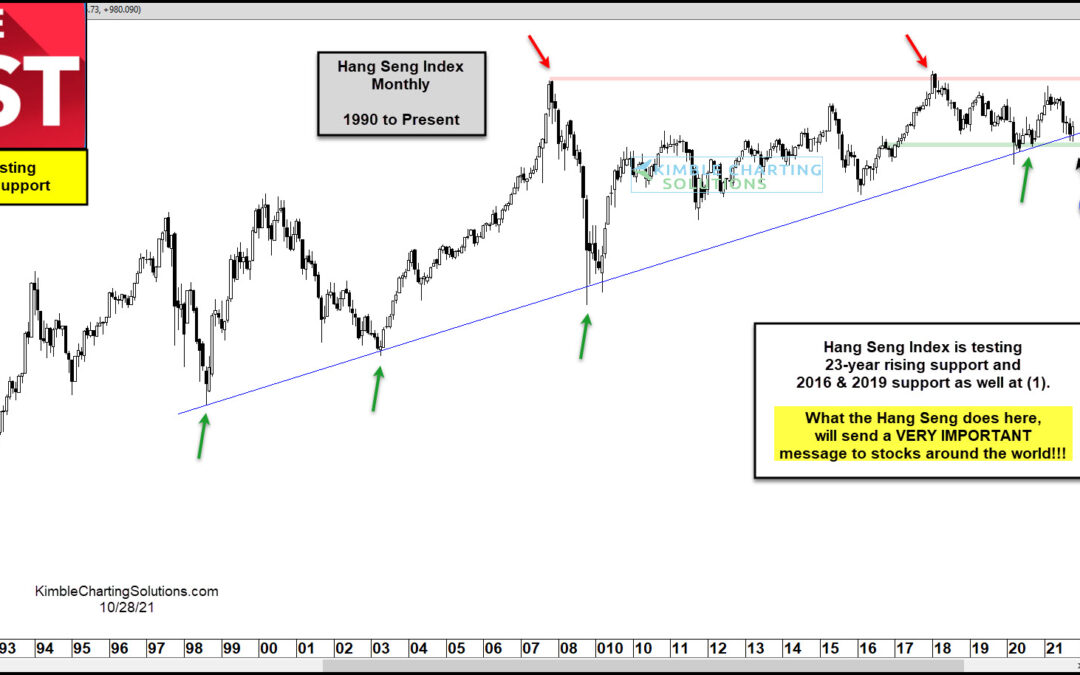
by Chris Kimble | Oct 29, 2021 | Kimble Charting
Amidst the on-going concerns about COVID, inflation, and a potential energy crisis, we also have China to worry about. That is, the Chinese stock market. And in particular, the Hang Seng Index. For the past few month, we have heard worries about the global economy and...
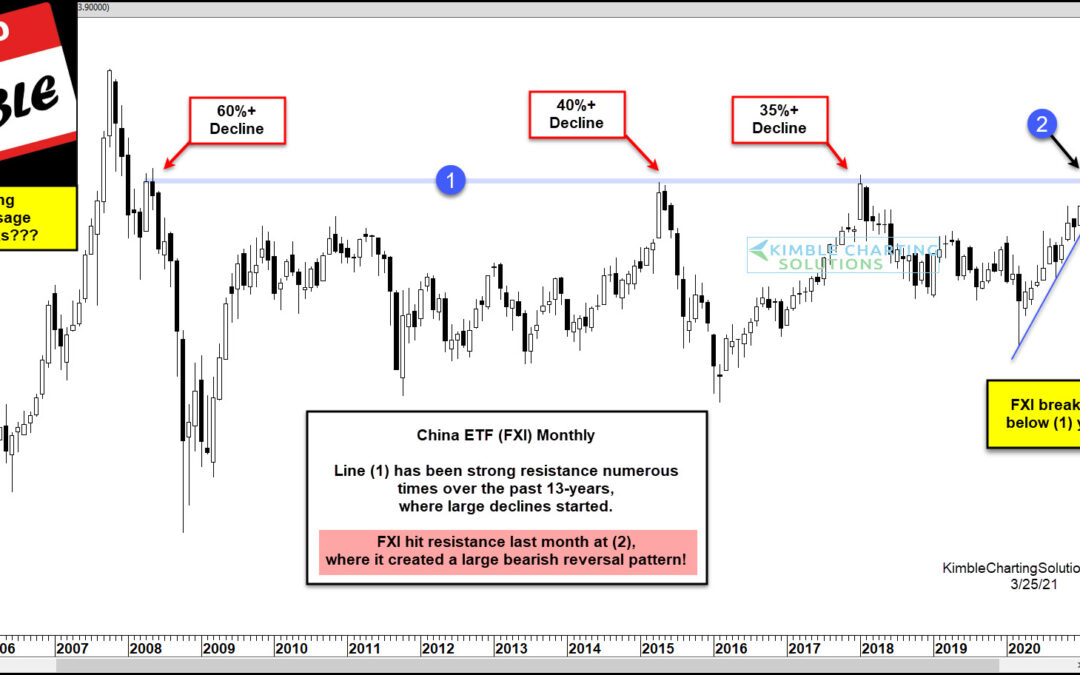
by Chris Kimble | Mar 25, 2021 | Kimble Charting
Is Big Trouble about to hit China? If history is a guide, the answer is yes. This chart looks at China ETF (FXI) on a monthly basis over the past 15-years. FXI has found line (1) to be resistance three different times in the past 13-years. At this resistance line, it...
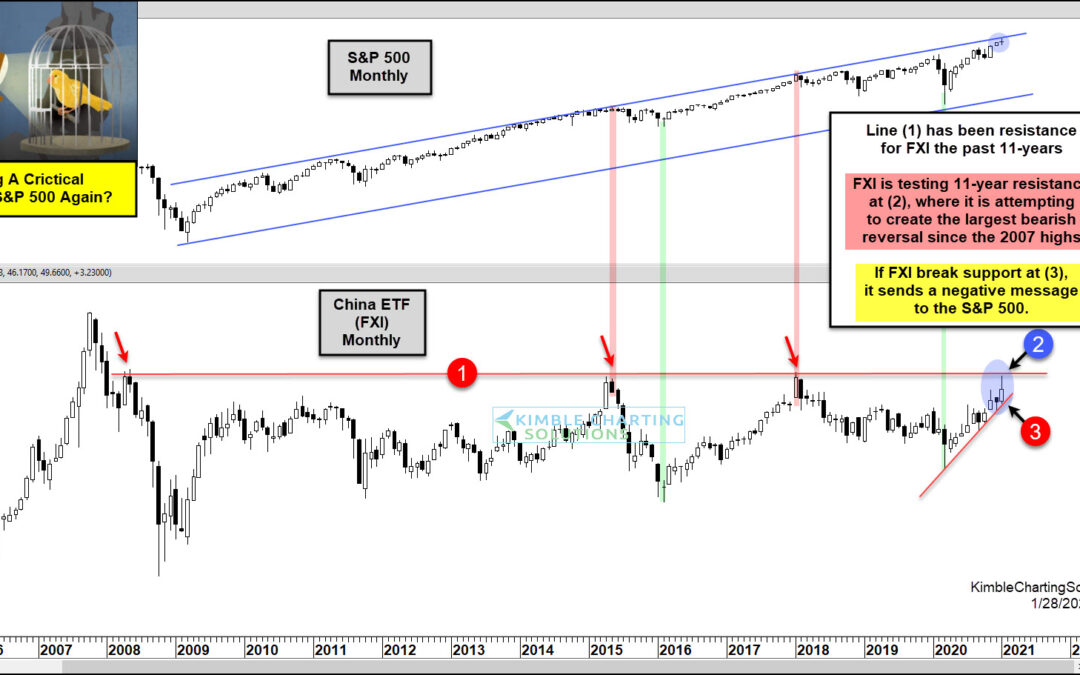
by Chris Kimble | Jan 29, 2021 | Kimble Charting
China has become critical factor in the global equity markets in the 21st century. Today we look at the ETF $FXI for China’s stock market and show how U.S. investors have received several timely bullish and bearish signals over the past decade-plus (when comparing FXI...
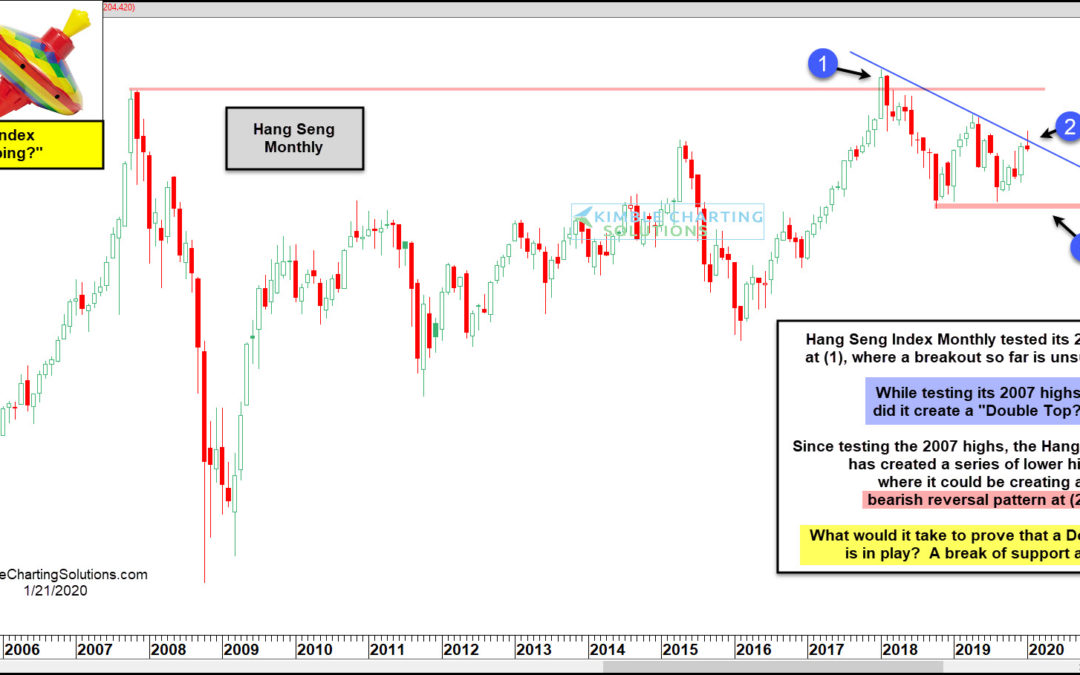
by Chris Kimble | Jan 21, 2020 | Kimble Charting
Could the Hang Seng Index be “Double Topping” at its 2007 highs? Possible, yet not proven! The Hang Seng Index attempted to break above its 2007 highs at (1), only to see a key reversal pattern take place the following month. After the reversal pattern,...
