by Chris Kimble | Sep 13, 2018 | Kimble Charting
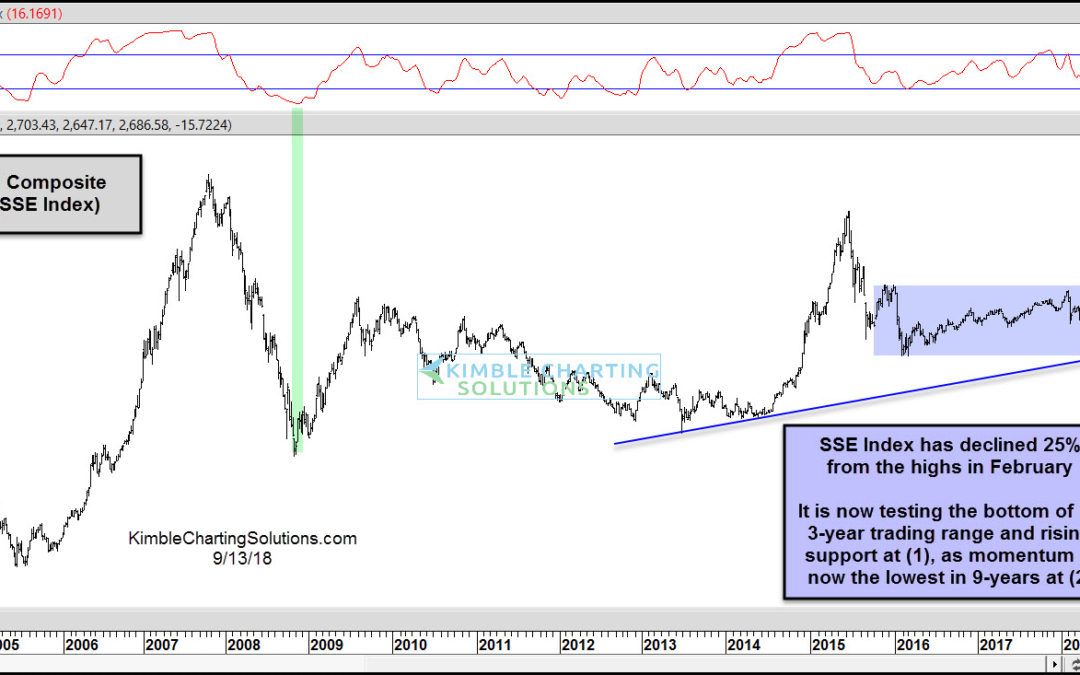
CLICK ON CHART TO ENLARGE While the S&P 500 and many indices in the states are trading near all-time highs, the same thing can’t be said for stocks in China! Since the highs in February, the Shanghai Index (SSE) has declined nearly 25%. Could this large...
by Chris Kimble | Sep 5, 2018 | Kimble Charting
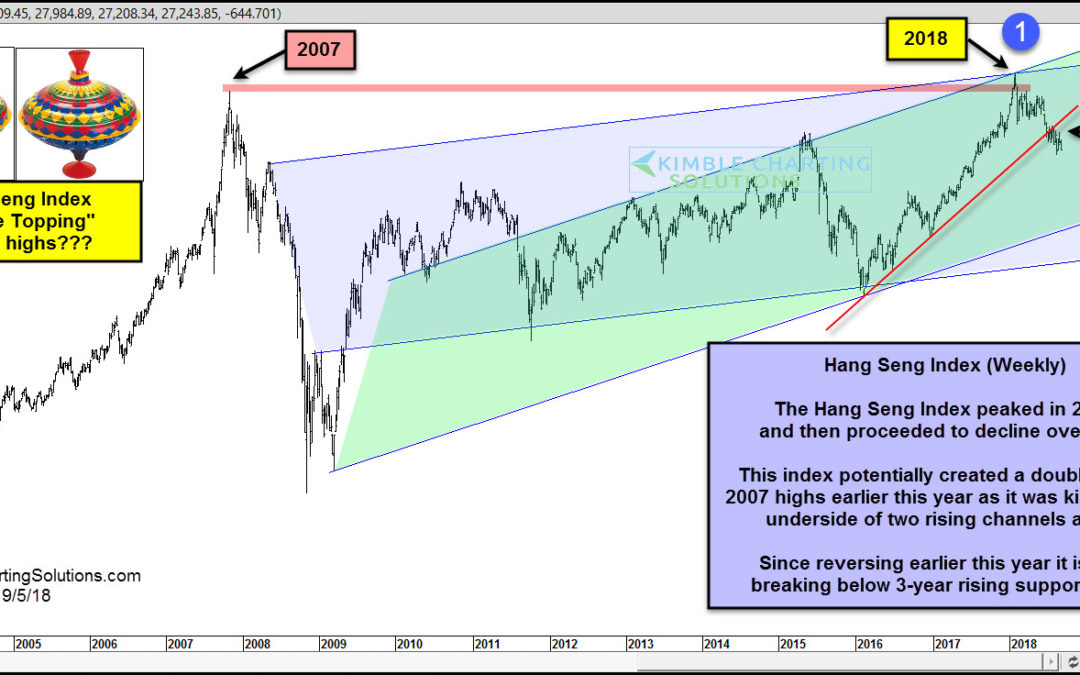
CLICK ON CHART TO ENLARGE Did the Hang Seng Index just create a “Double Top” at the same price it peaked in 2007? Let’s investigate! This chart looks at the Hang Seng Index on a weekly basis over the past 15-years. As you can see it peaked in 2007...

by Chris Kimble | Feb 8, 2018 | Kimble Charting
Stocks in the states have done well the past few years and so have stocks in Emerging Markets countries and China Below looks at popular Emerging Markets ETF (EEM) and China ETF (FXI) over the past 10-years- CLICK ON CHART TO ENLARGE EEM & FXI have both done...

by Chris Kimble | Oct 14, 2017 | Kimble Charting
Emerging Markets ETF (EEM) did something this week, it has been unable to do numerous times over the past 5-years. Below looks at the price pattern of EEM over the past 10-years. CLICK ON CHART TO ENLARGE EEM has done well since the start of 2016, reflecting gains...
by Chris Kimble | Apr 17, 2015 | Kimble Charting
CLICK ON CHART TO ENLARGE When it comes to investing in the stock market, do you feel leadership can be important. If so, you might want to pay attention to price action from a key global stock index. China has been in the news for hot stock market performance that...

by Chris Kimble | Apr 8, 2015 | Kimble Charting
CLICK ON CHART TO ENLARGE I wish I had a Dollar for every time I heard that China can’t do well if Copper isn’t moving higher. Over the past 6 months, China ETF FXI is up 28% while Copper ETF JJC is down over 10%. This is nearly a 40% performance...

by Chris Kimble | Apr 6, 2015 | Kimble Charting
Is an important Paradigm Shift about to take place? Could be! For the past few years, the S&P 500 has been a much better asset to own when comparing performance against China, Hong Kong, Japan, South Korea and Emerging Markets. The 6-pack below looks at 5-ratios...

by Chris Kimble | Oct 7, 2014 | Kimble Charting
This morning the IMF lowered its forecast for global growth. Are they attempting to lower the bar on expectations going forward? Do they know something we don’t? Should one pay attention to forecasts or prices? CLICK ON CHART TO ENLARGE The...
