

Is an important Paradigm Shift about to take place? Could be!
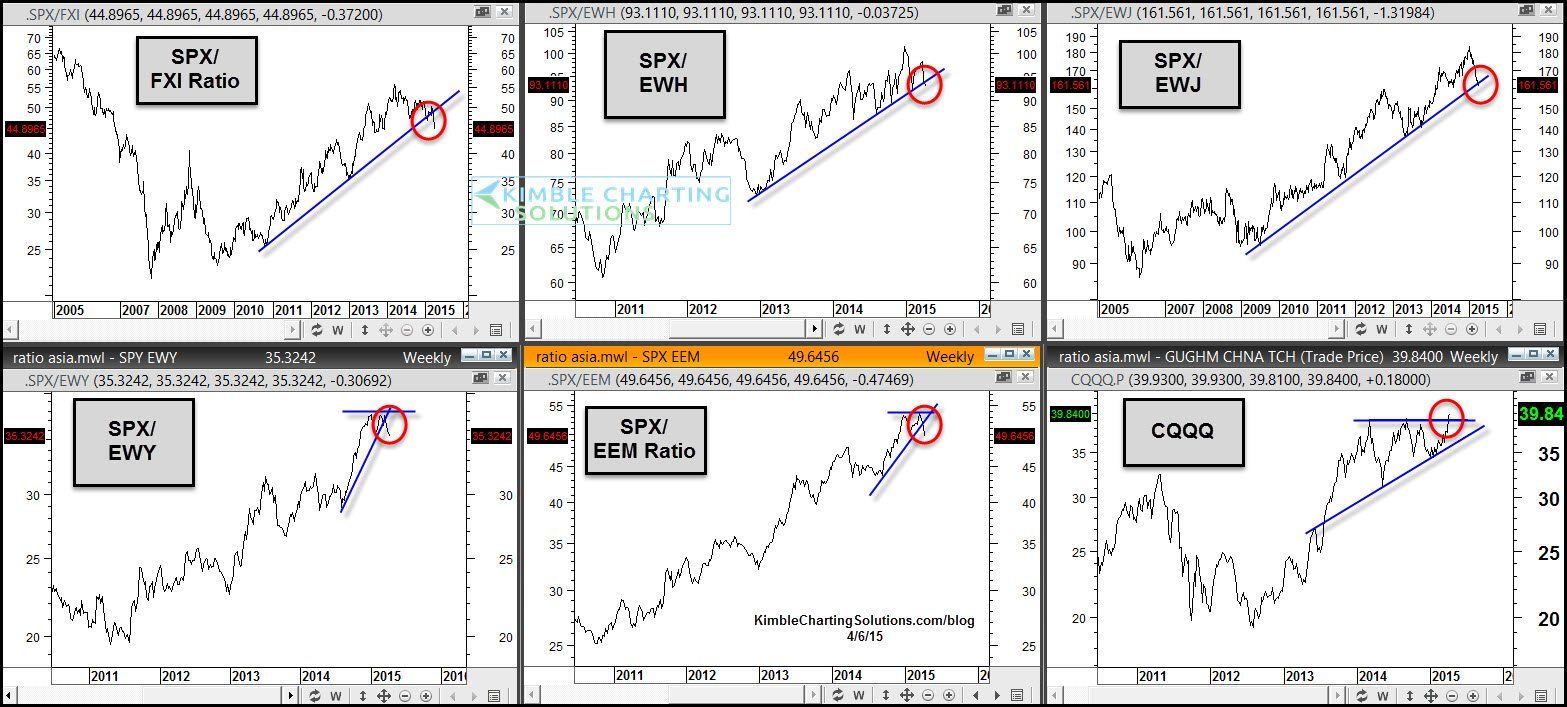
For the past few years, the S&P 500 has been a much better asset to own when comparing performance against China, Hong Kong, Japan, South Korea and Emerging Markets. The 6-pack below looks at 5-ratios comparing the S&P 500 against several international ETF’s. When the ratio is heading higher, it means that the S&P 500 is stronger.
 CLICK ON CHART TO ENLARGE
As the ratios have headed higher over the past few years, meaning it has paid to long the S&P against these ETF’s. Of late a few support lines are starting to give way, reflecting that the S&P 500 has been weaker against these ETF’s.
When it comes to global investing is a Paradigm shift taking place? If these ratios head lower, it would reflect global strength against the S&P 500, which has been rare over the past few years!
The Power of the Pattern shared last week that Crude Oil averaged a 50% gain 12 months out, after it created a 10% reversal pattern, following a 40% decline over the past year. (See Post Here)
If Crude Oil would do well over the next 12 months, the ratios above could keep heading lower!
Lower right chart of the 6-pack above reflects and attempt by Chinese Tech companies to breakout of the bullish ascending triangle pattern in CQQQ.
See more of our research by clicking button below…

