
by Chris Kimble | Apr 14, 2016 | Kimble Charting
Junk Bonds don’t have much to brag about over the past few years. An attempt is being made to change that trend. Below looks at Junk Bond ETF HYG. CLICK ON CHART TO ENLARGE Junk bonds are often viewed as leading indicators for the future direction of the stock...

by Chris Kimble | Jan 8, 2016 | Kimble Charting
CLICK ON CHART TO ENLARGE Junk bonds have been in the news a ton over the past few months, mostly in a bad way, as they have been falling in price since April of 2014. The chart above looks at the Junk Bond (HYG)/S&P 500 ratio. As you can see, the ratio has been...

by Chris Kimble | Dec 23, 2014 | Kimble Charting
CLICK ON CHART TO ENLARGE Outflows from mutual funds have been rather large of late, actually the biggest in the past three years at (2), reported by Sentiment Trader. At the same time this took place, Junk bonds have been hit hard, driving them down to three year...

by Chris Kimble | Dec 18, 2014 | Kimble Charting
CLICK ON CHART TO ENLARGE If one likes the idea of buying low and selling higher, junk bonds might come to mind due to how hard they’ve been hit of late! The chart below highlights that an unusual and large performance spread between JNK and the S&P...
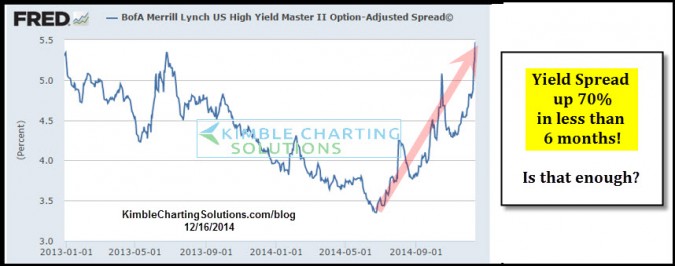
by Chris Kimble | Dec 16, 2014 | Kimble Charting
CLICK ON CHART TO ENLARGE When it comes to interest rate rallies, Russia tops this list this morning as they raised rates 70% in a day, attempting to stem the rapid decline in the Ruble. Speaking of interest rate rallies….Did you know the yields on...

by Chris Kimble | Dec 3, 2014 | Kimble Charting
CLICK ON CHART TO ENLARGE Many feel investors should “listen” to the message coming from Junk Bonds, due to them sometimes being a leading indicator for the stock market. The 2-pack above takes a look at the two largest Junk Bond ETF’s. JNK...

by Chris Kimble | Sep 26, 2014 | Kimble Charting
CLICK ON CHART TO ENLARGE In the late 1990’s and 2007 the Pimco High Yield fund (PHDAX) formed bearish rising wedges. Once support broke the fund rallied to kiss the underside of the wedge and its 200MA at each (1), then it proceeded to fall a large...
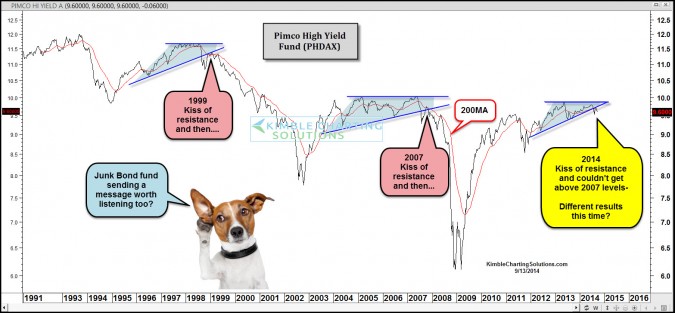
by Chris Kimble | Sep 13, 2014 | Kimble Charting
CLICK ON CHART TO ENLARGE The Pimco High Yield fund (PHDAX) for a period of time around from 1997 to 1999 & 2005 to 2007 found it difficult to move higher, creating a series of level highs. At the same time it created a series of higher lows. Once old...
