
CLICK ON CHART TO ENLARGE
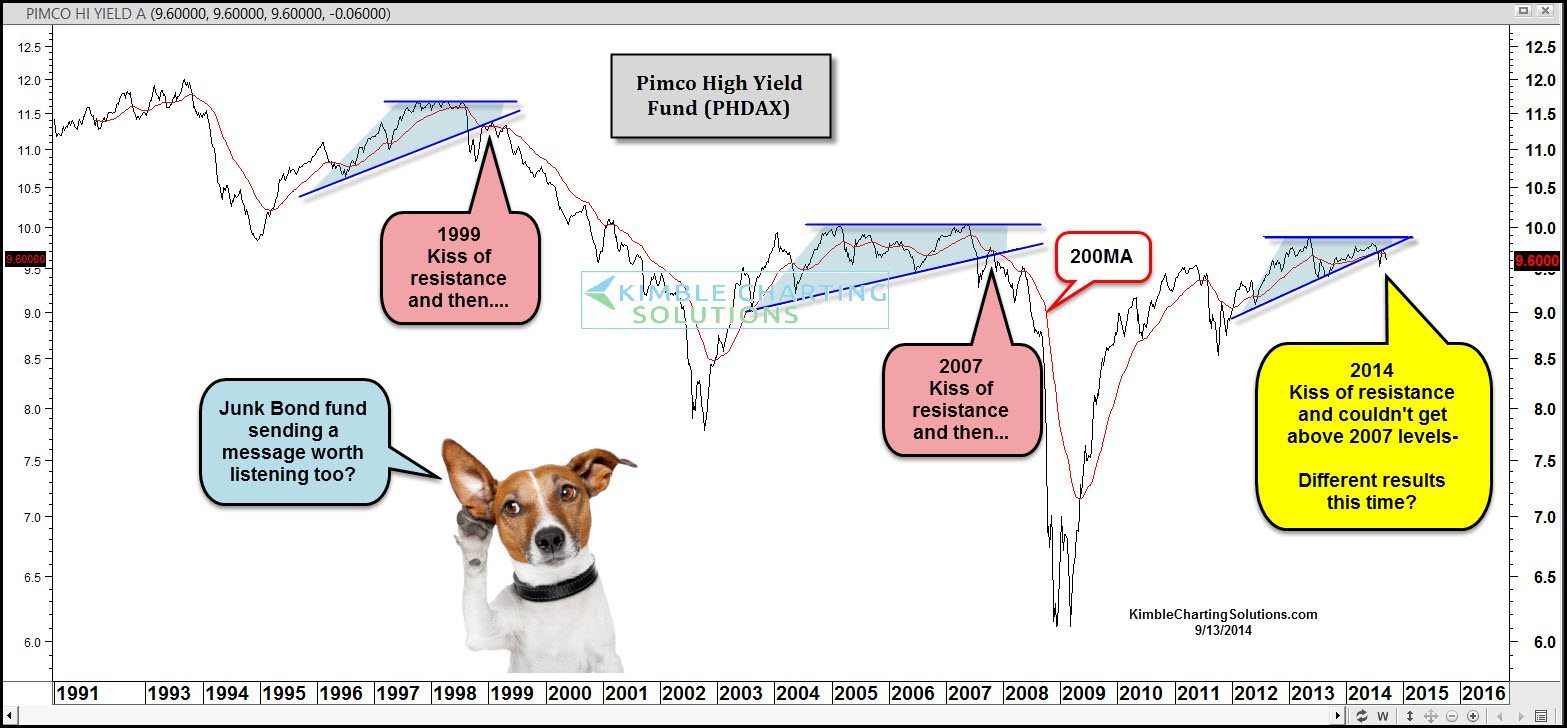
The Pimco High Yield fund (PHDAX) for a period of time around from 1997 to 1999 & 2005 to 2007 found it difficult to move higher, creating a series of level highs. At the same time it created a series of higher lows. Once old support was tested as resistance and it failed to move higher, large declines in junk bonds and the stock market took place.
Over the past couple of years, the fund may have created a pattern that looks similar to 1999 & 2007, as it seem to have trouble getting above the highs hit in 2007.
CLICK ON CHART TO ENLARGE
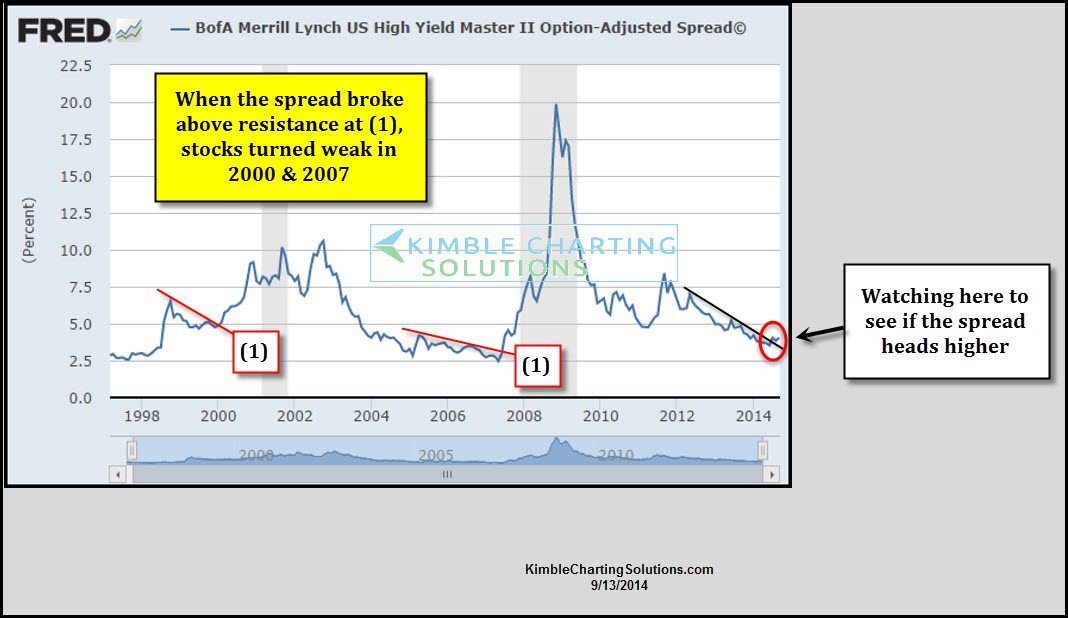
The above chart of the B of A/Merrill Lynch high yield adjusted spread highlights that when sharp rallies took place in 2000 & 2007, stocks turned soft.
It might pay to keep a close eye on the Pimco high yield fund and the adjusted spread in the next few weeks, to see if any important messages come from the junk bond complex.
–
-
