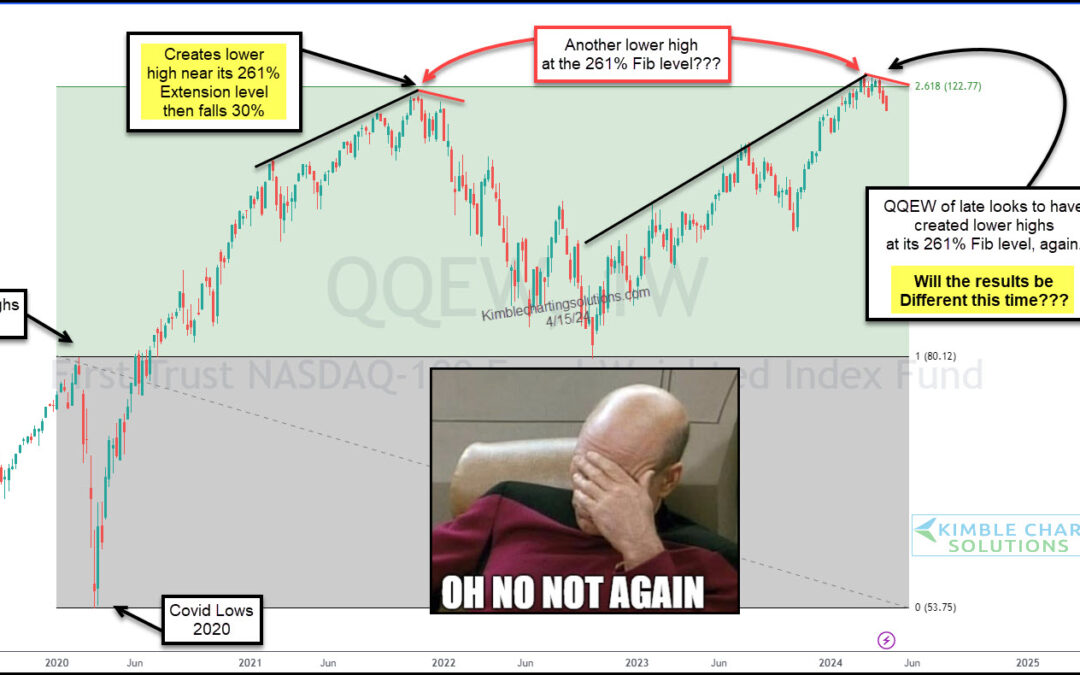
by Chris Kimble | Apr 17, 2024 | Kimble Charting
Technology stocks have been the engine behind the stock market rally into 2024. Even better stated, tech stocks have been a market leader since 2009. So it’s important to keep an eye on the performance of market leadership. And lately the tech-based Nasdaq indices...
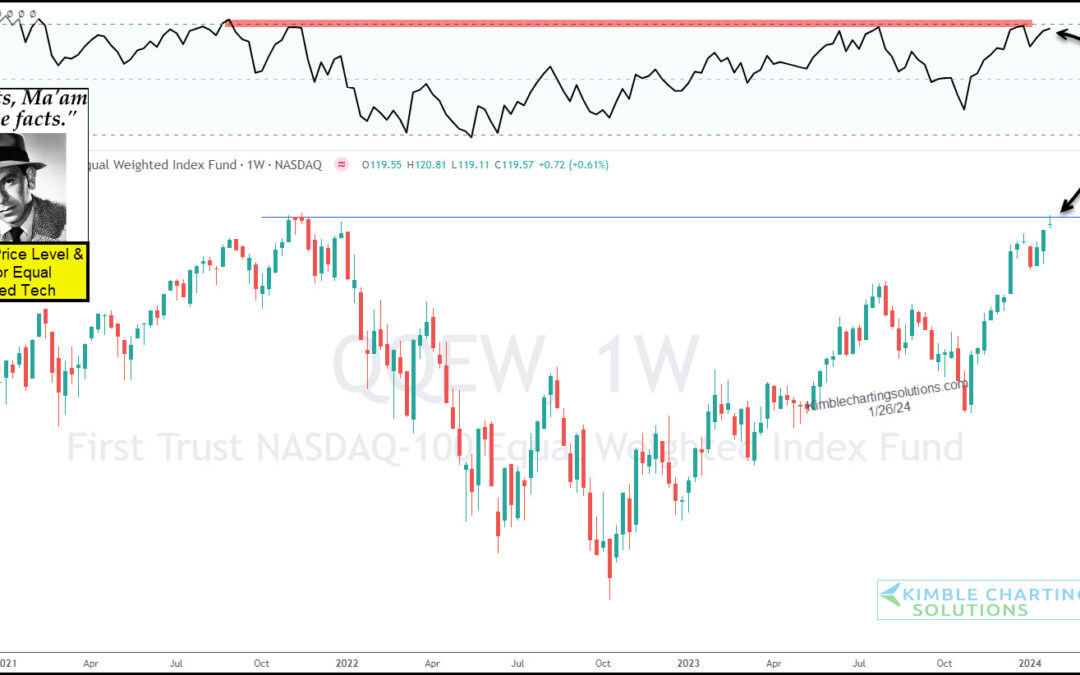
by Chris Kimble | Jan 29, 2024 | Kimble Charting
The end of year rally has trickled over into 2024 and it has been lead by tech stocks. But has the rally gotten long in the tooth? “The facts, Ma’am. Just the Facts.” – Joe Friday Today’s “weekly” chart of the Nasdaq 100 Equal Weight Fund (QQEW) highlights an...
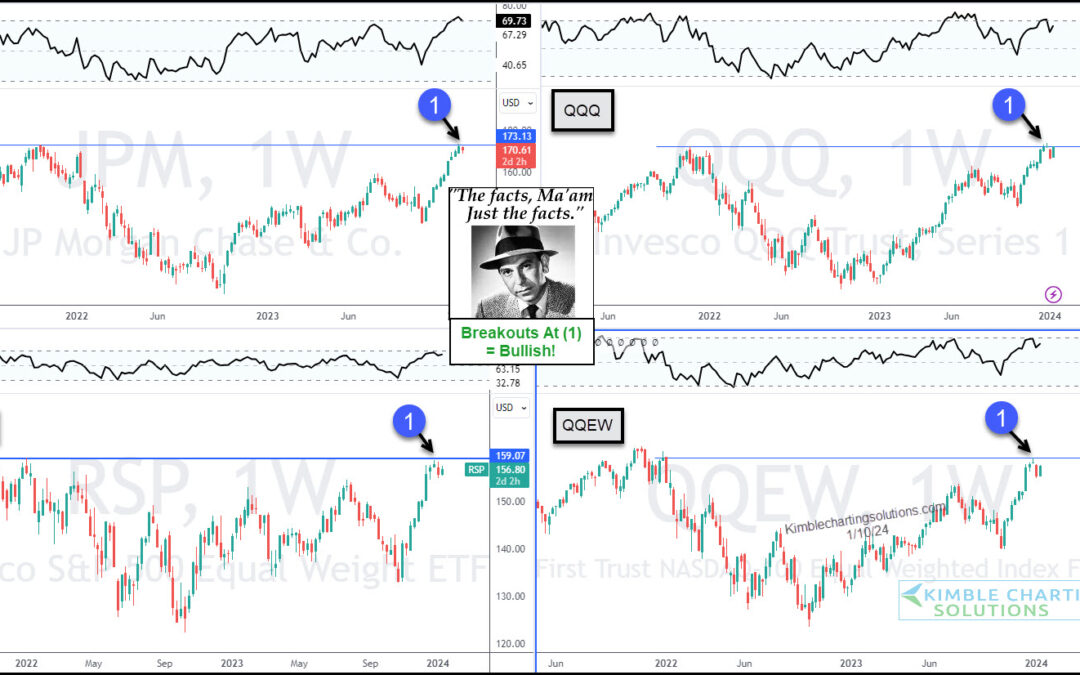
by Chris Kimble | Jan 12, 2024 | Kimble Charting
After a big year-end rally, the stock market attempts to consolidate gains in January. That consolidation has several stock indices and ETFs trading near recent price highs. “The facts, Ma’am. Just the facts.” – Joe Friday Today’s chart 4-Pack highlights a key bank...
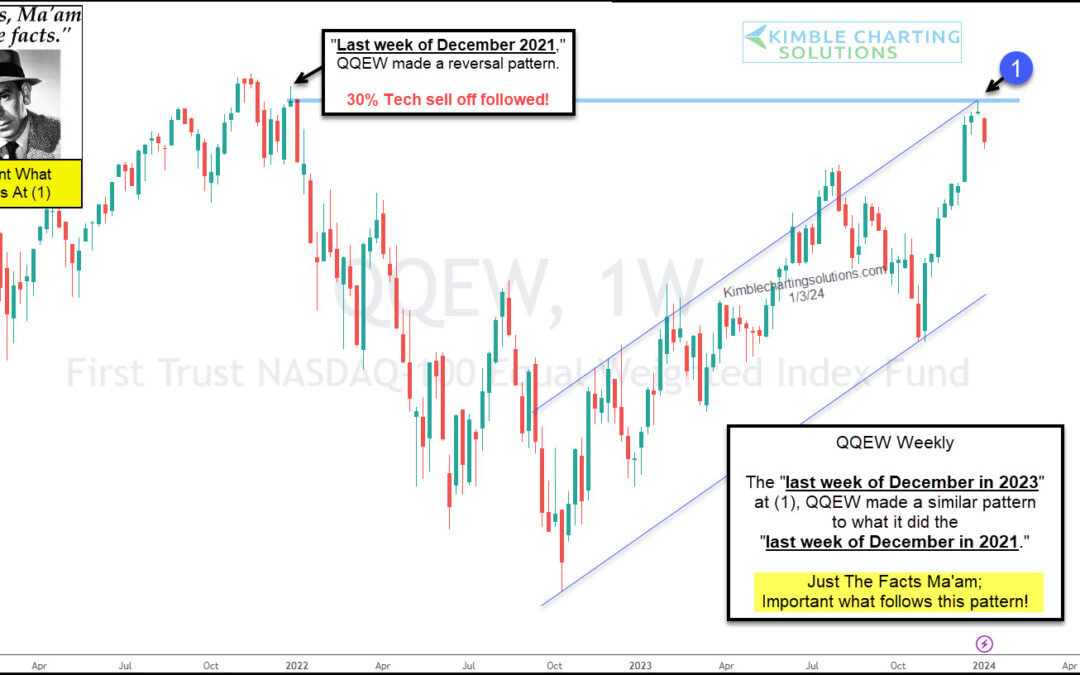
by Chris Kimble | Jan 5, 2024 | Kimble Charting
We have spent a lot of time discussing the importance of technology stocks and how this area of leadership is a great “tell” for what’s to come. Today, we look at the Nasdaq 100 Equal Weight ETF (QQEW) and highlight why market participants should be watching right...
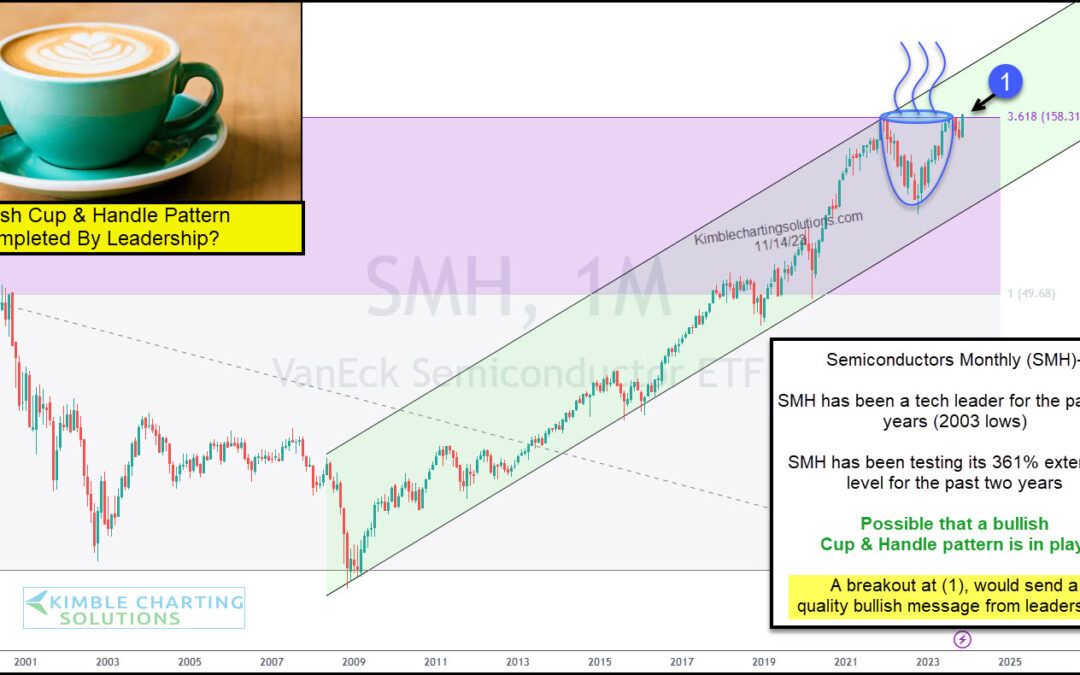
by Chris Kimble | Nov 16, 2023 | Kimble Charting
The Semiconductors Sector ETF (SMH) has been a market leading sector for nearly two decades. And after a brief swoon, the Semiconductors (SMH) are heating up once again. Today’s chart is a long-term “monthly” view of the SMH. As you can see, this market leading sector...
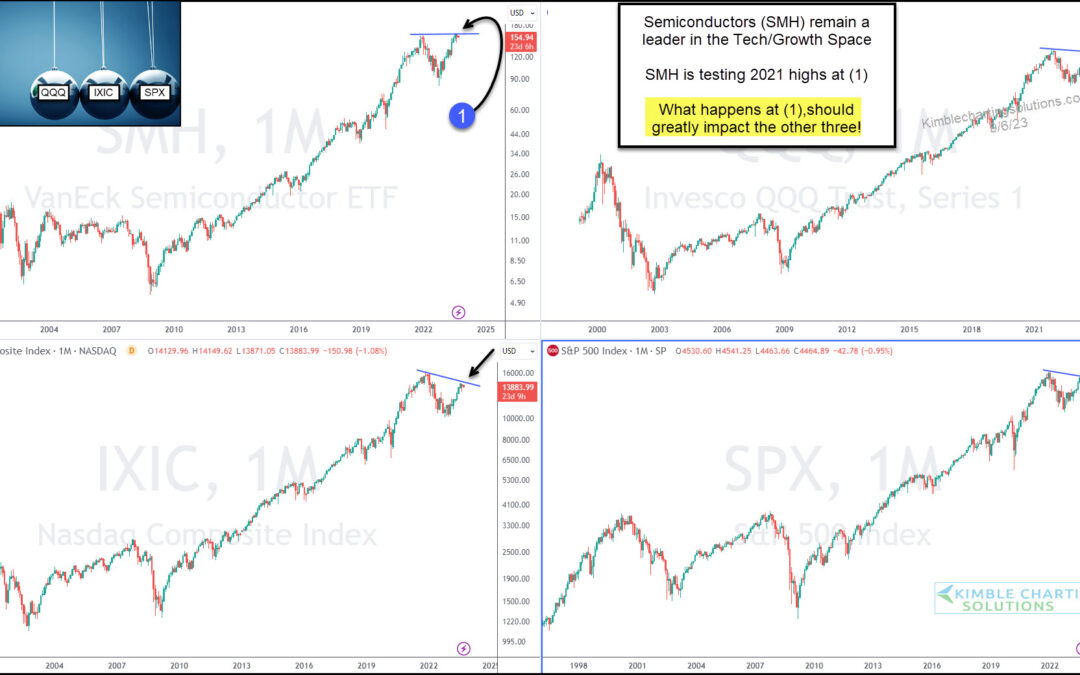
by Chris Kimble | Sep 13, 2023 | Kimble Charting
Without a doubt, technology stocks are the leader within global stock markets and the global economy. So when the technology sector nears a major trend decision point, investors and consumers should be watching! And that is exactly what we have on display today, as...
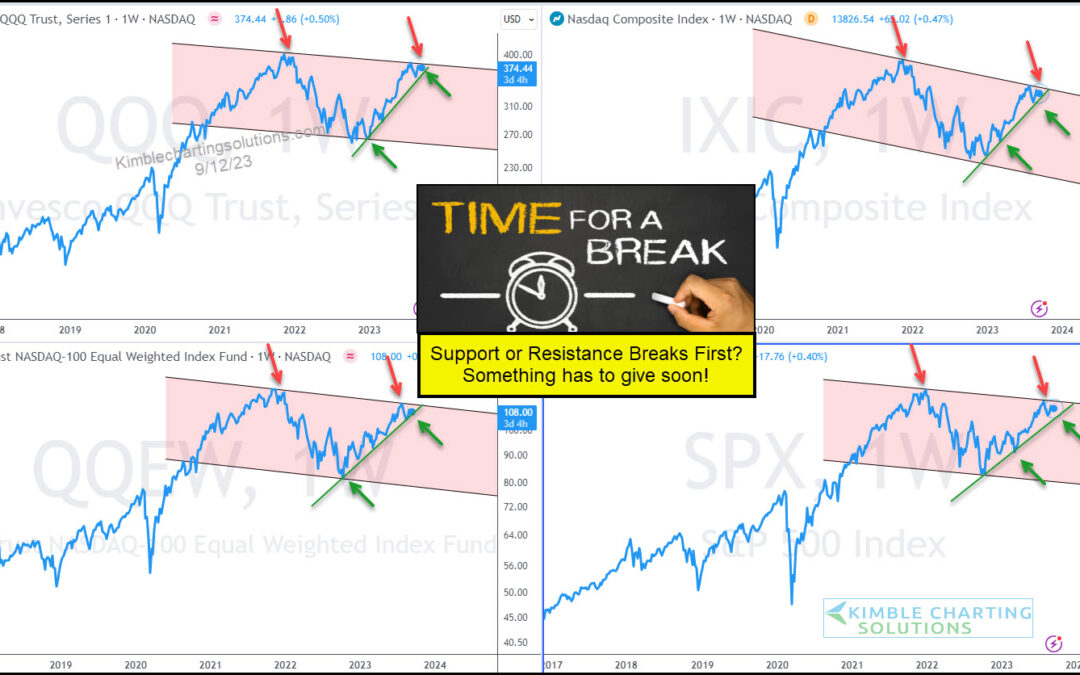
by Chris Kimble | Sep 8, 2023 | Kimble Charting
The stock market appears to be limping its way through the final stages of its rally. The major stock market indices have yet to make new highs and are in stall-out mode. A bit concerning, eh? These concerns are on full display in today’s chart 4-pack. As you can see,...
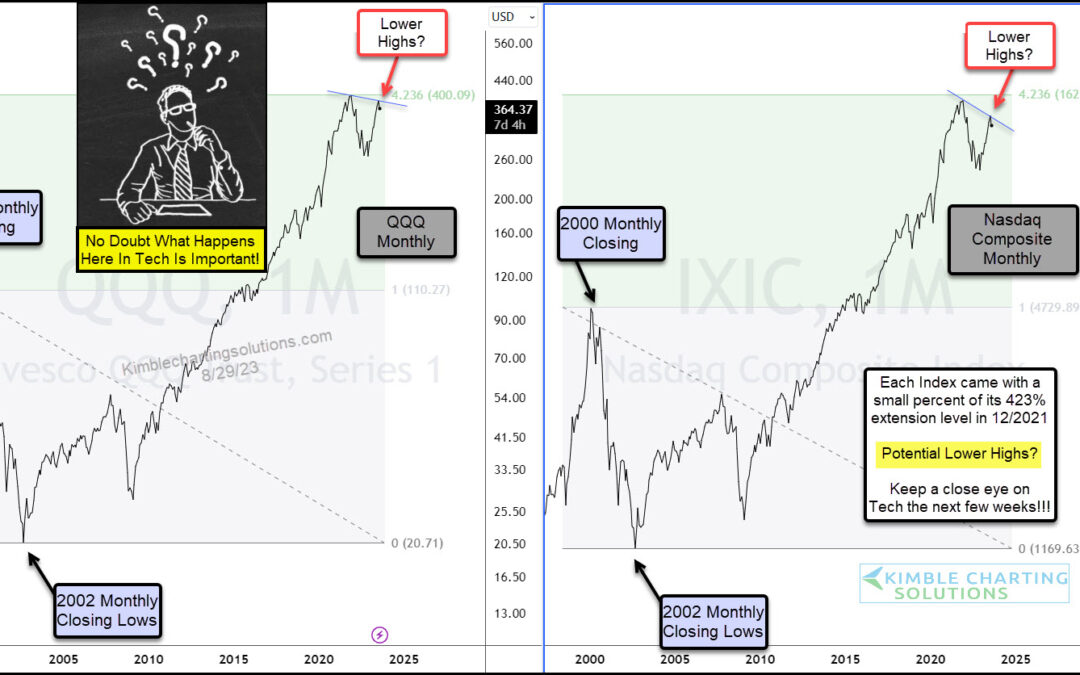
by Chris Kimble | Aug 30, 2023 | Kimble Charting
Several stock market indices and sectors are nearing important trading points within various patterns. But arguably none more important than the major technology indices. Today we highlight the Nasdaq 100 ETF (QQQ) along with the Nasdaq Composite Index. As you can...
