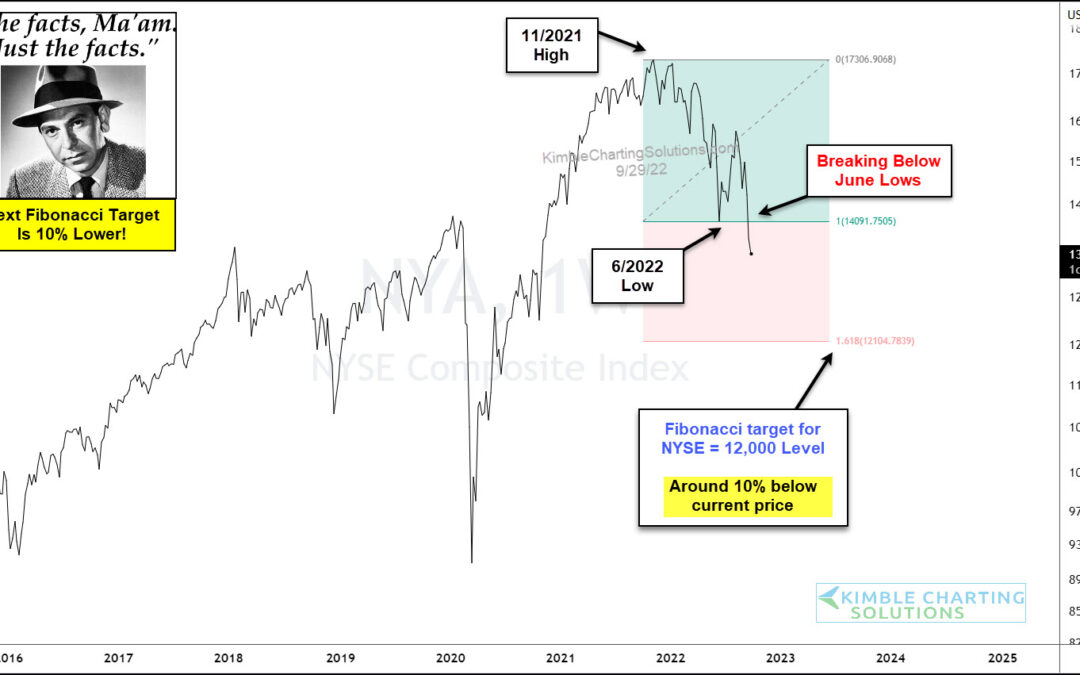
by Chris Kimble | Sep 30, 2022 | Kimble Charting
Earlier this week, we highlighted how the NYSE Composite was breaking to new lows. Well, this week we are seeing follow-through selling. This is a broad-based index so investors should heed its cautionary signal. Joe Friday: “The facts, Ma’am. Just the facts.” There...

by Chris Kimble | Sep 29, 2016 | Kimble Charting
Below compares the price patterns of Crude Oil and the NYSE Index over the past 8-years. Crude and the NYSE don’t always correlate, over the past couple of years though, they have in a big way! CLICK ON CHART TO ENLARGE Since early 2015, the correlation between...

by Chris Kimble | Jul 5, 2016 | Kimble Charting
Sometimes, people look alike and sometimes patterns look alike. Below looks at the most important commodity on the planet (Crude Oil) and the New York Stock Exchange (NYSE) Index. CLICK HERE TO ENLARGE CHART ABOVE As the world starts drifting away from the Brexit...

by Chris Kimble | Jun 30, 2016 | Uncategorized
Below compares the prices of Crude Oil and the New York Stock Exchange Index (NYSE) over the past couple of years. Once Crude peaked in 2014, the NYSE Index make little upward movement after than, even though the trend for the prior few years was clearly up. Over the...

by Chris Kimble | Jun 24, 2016 | Uncategorized
CLICK ON CHART TO ENLARGE The NYSE index kissed the underside of dual resistance at (1) back in 2008. Once resistance held, a big push away from it took place and sellers stepped forward. NYSE creating a similar pattern again at (2)??? This would NOT be a good place...

by Chris Kimble | Jun 22, 2016 | Uncategorized
The financial focus around the world right now seems to be the “Brexit” vote tomorrow in Europe. Even though that vote is important, we are most interested in the reactions of investors, after the vote. The 3-pack below looks at some key sectors in the...
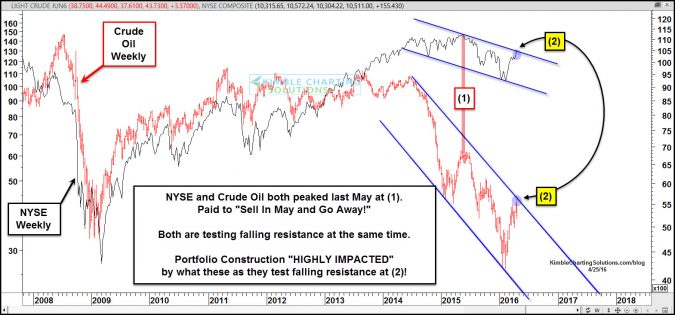
by Chris Kimble | Apr 25, 2016 | Kimble Charting
CLICK ON CHART TO ENLARGE A popular theme has been to “Sell In May, and Go Away!” Following this idea paid off last year, will it again this year? Historically, stock market performance hasn’t been the strongest from May to October and last...

by Chris Kimble | Oct 26, 2015 | Kimble Charting
CLICK ON CHART TO ENLARGE The “Big Apple” index (NYSE Composite), remains inside of the rising channel that has been in play for the past 50-years. If one applies Fibonacci retracement levels to the 2009 monthly closing lows and the highest monthly close...
