CLICK ON CHART TO ENLARGE
A popular theme has been to “Sell In May, and Go Away!” Following this idea paid off last year, will it again this year?
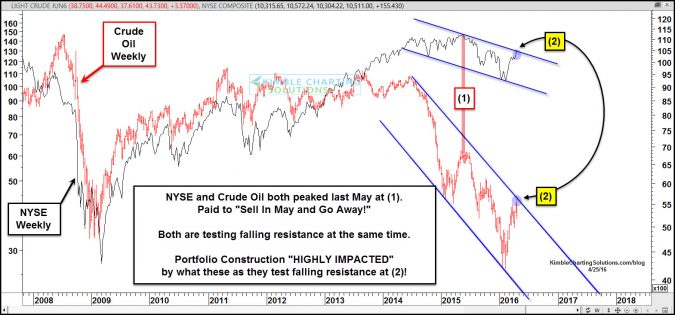
Historically, stock market performance hasn’t been the strongest from May to October and last year was no exception. The above chart looks at Crude Oil and the New York Stock Exchange, over the past 8-years. As you can see, a decent correlation has been taking place with these two.
A year ago, Crude Oil and the NYSE Index both peaked in May at (1) above. It paid to lower exposure to Crude Oil and Stocks a year ago.
Crude Oil and the NYSE Index both remain in down trends (lower highs and lower lows). Both are attempting to change this trend, as both are testing falling channel resistance at (2) above.
At this time, resistance and resistance is resistance until broken.
Both assets are testing breakout levels at this time. Portfolio construction could be highly influenced by what both of these do at (2) above.
How these assets performance at resistance, could go along way, in determining if one should “Sell In May” this year!
If both of these breakout, it could well be different this time!!!
–


