by Chris Kimble | Sep 8, 2023 | Kimble Charting
The stock market appears to be limping its way through the final stages of its rally. The major stock market indices have yet to make new highs and are in stall-out mode. A bit concerning, eh? These concerns are on full display in today’s chart 4-pack. As you can see,...
by Chris Kimble | Aug 30, 2023 | Kimble Charting
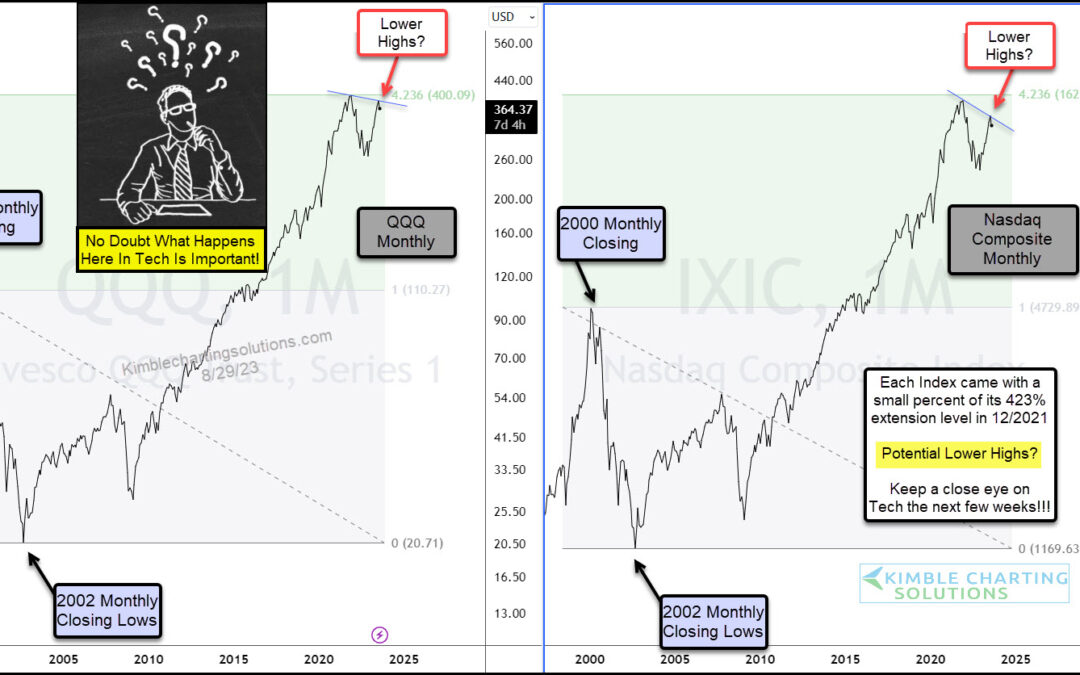
Several stock market indices and sectors are nearing important trading points within various patterns. But arguably none more important than the major technology indices. Today we highlight the Nasdaq 100 ETF (QQQ) along with the Nasdaq Composite Index. As you can...
by Chris Kimble | Aug 25, 2023 | Kimble Charting
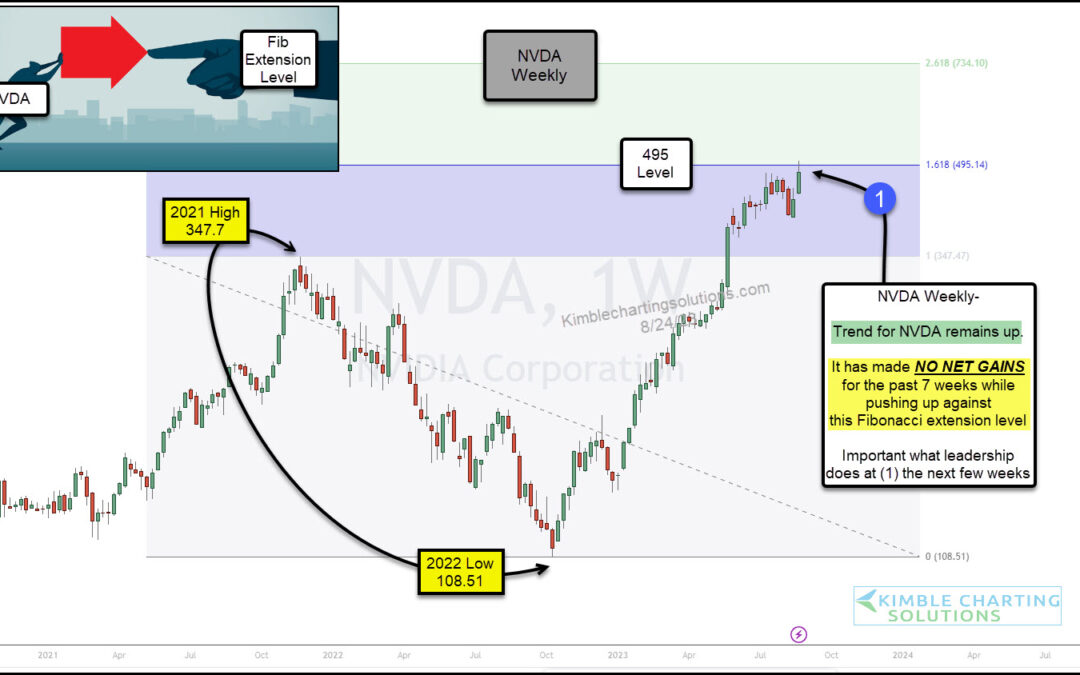
Today we discuss one of the technology sector’s darlings. It’s a market leader and a high-flier… it’s Nvidia (NVDA). The stock price recently surged after the company hit a homerun with their recent earnings announcement. But something important seems to be jumping...
by Chris Kimble | Aug 18, 2023 | Kimble Charting
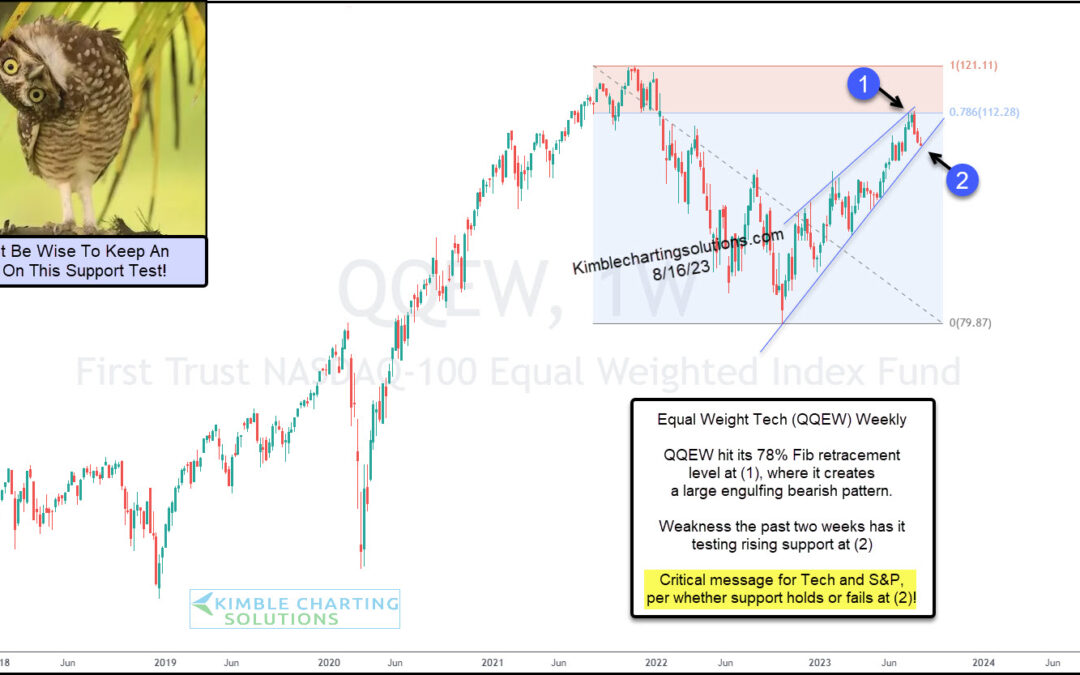
Tech stocks have been leaders once again in 2023 following its broad-based correction into 2022. BUT, we are not out of the woods just yet! Today’s chart looks at the Equal Weight Nasdaq 100 ETF (QQEW) and provides an insightful snapshot of the current state of large...
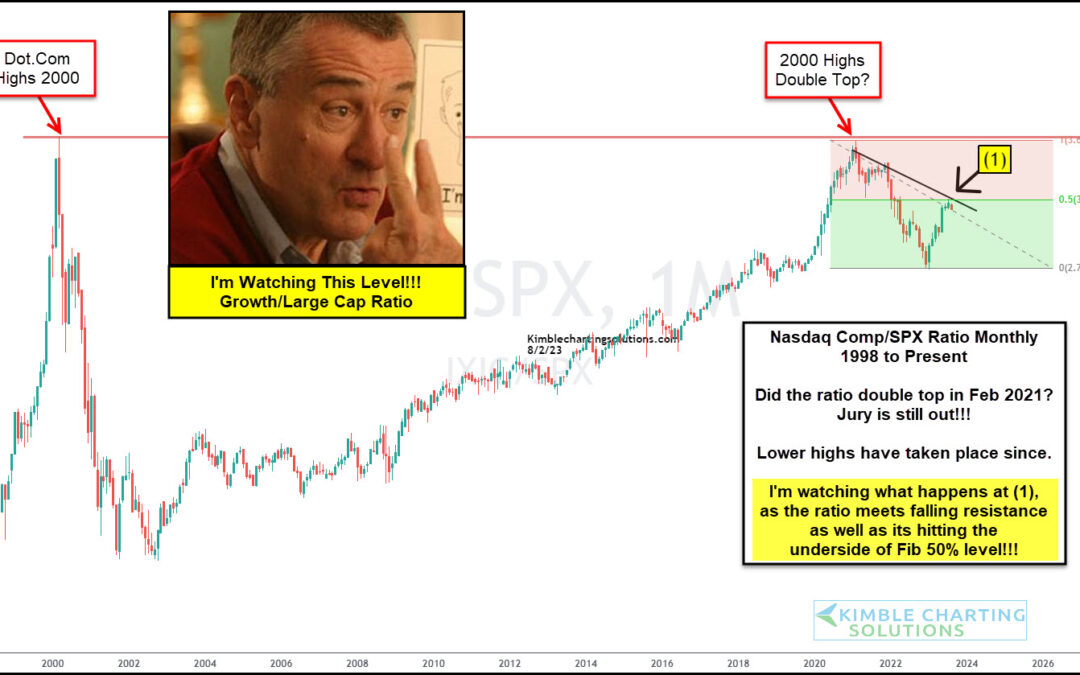
by Chris Kimble | Aug 3, 2023 | Kimble Charting
The main bank of stock market leadership has come from the technology sector. Let’s face it, tech stocks have been market leaders for years and a core driver of our economy. BUT the post-COVID Nasdaq performance versus the S&P 500 has not been great. The bright...
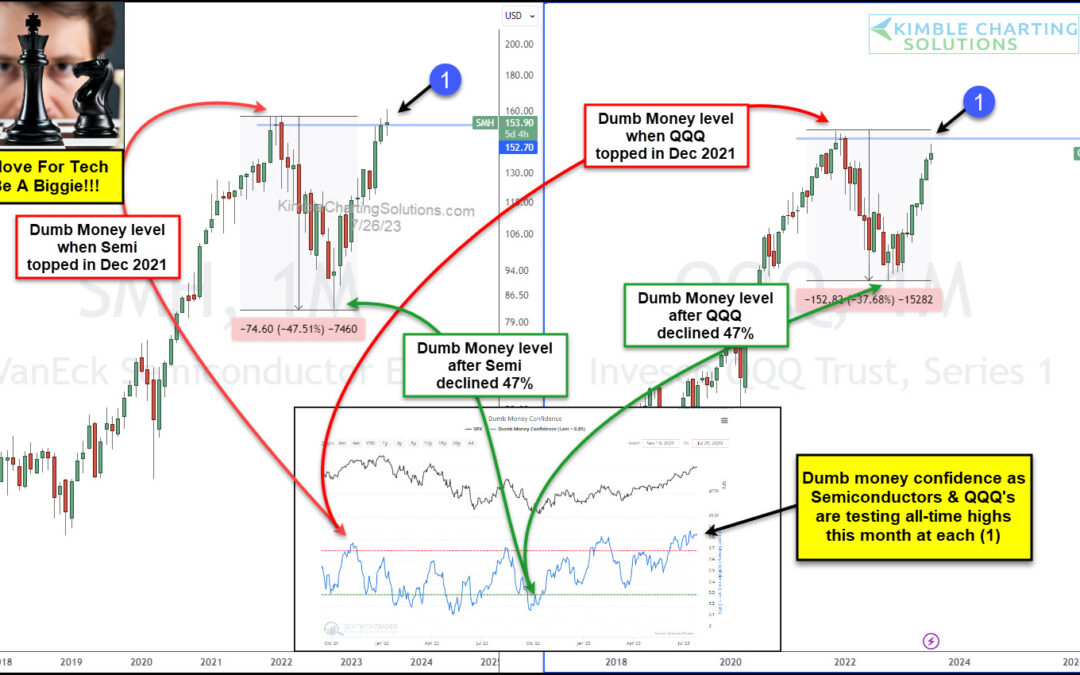
by Chris Kimble | Jul 27, 2023 | Kimble Charting
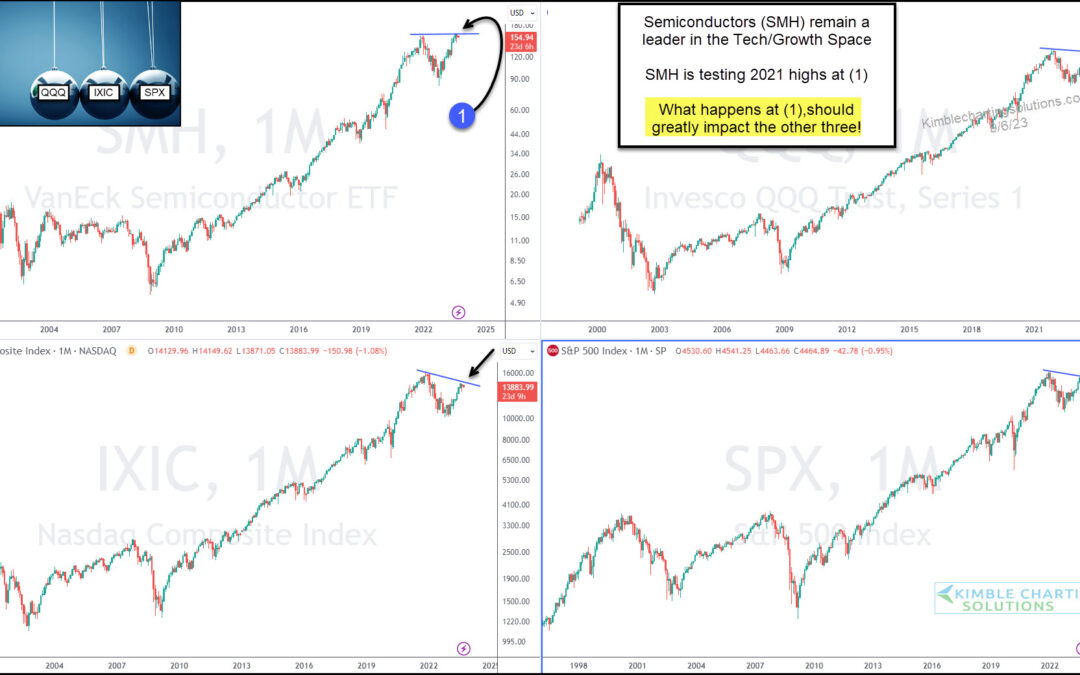
As we have pointed out several times, the Nasdaq and tech stocks (i.e. Semiconductors) are critically important leaders for the stock market. And wouldn’t you know it, both the Nasdaq 100 ETF (QQQ) and Semiconductors ETF (SMH) are approaching all-time highs (which...
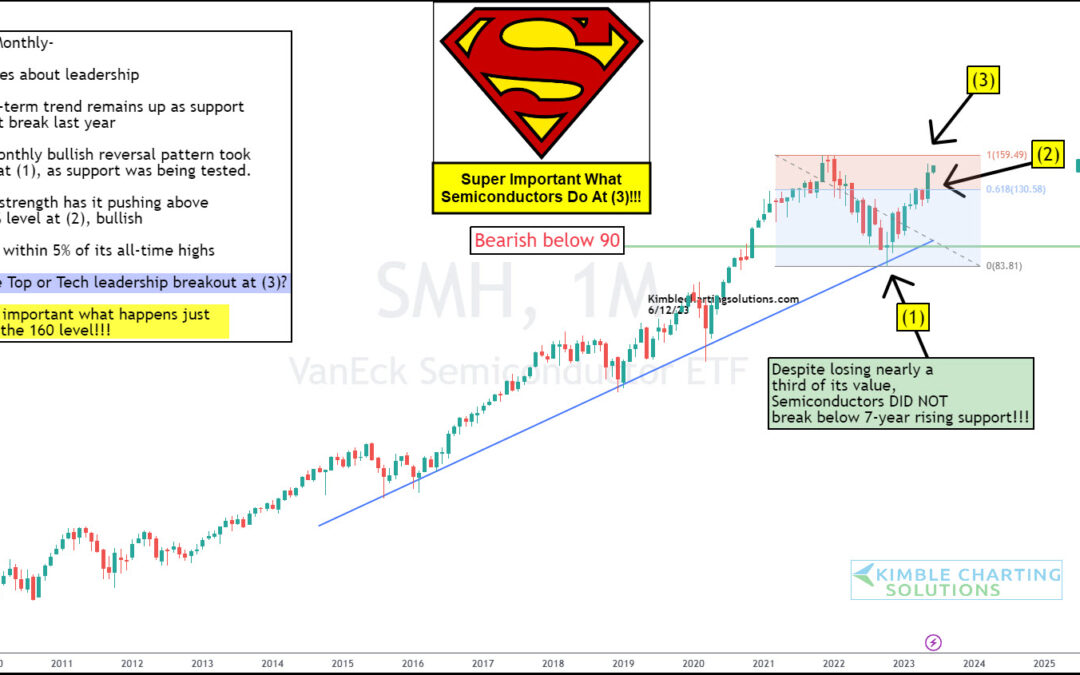
by Chris Kimble | Jun 14, 2023 | Kimble Charting
We often talk about the importance of leadership in the markets. For active investors, it tells us which sectors are out-performing and warns us when those sectors begin to falter. Today is a great example. Below is a long-term “monthly” chart of the Semiconductors...
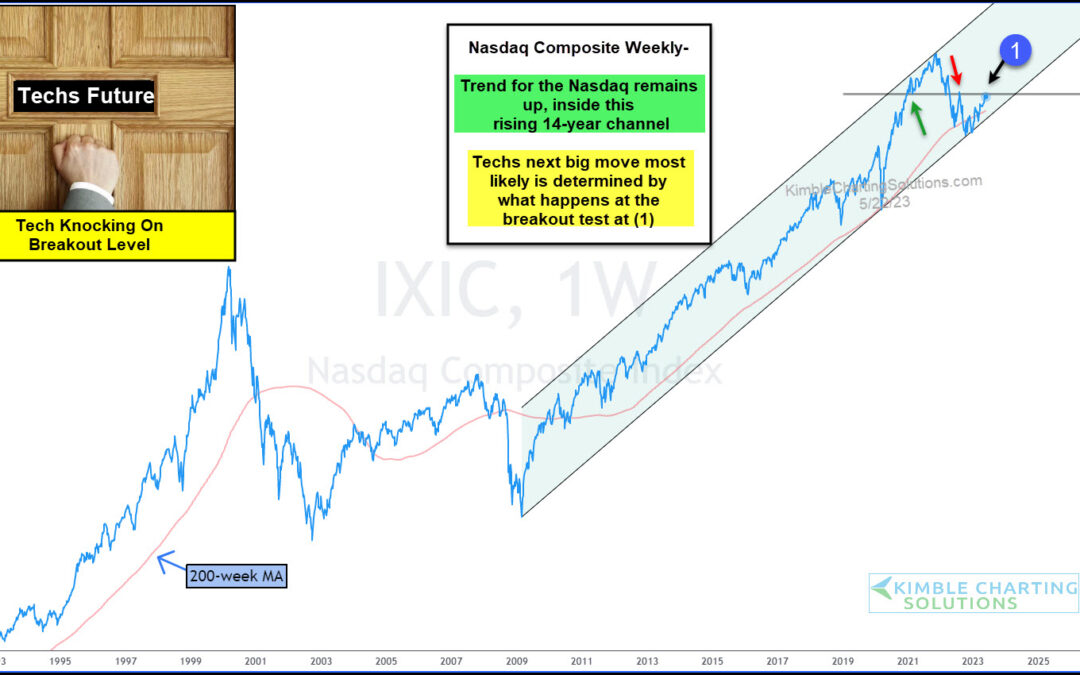
by Chris Kimble | May 24, 2023 | Kimble Charting
Technology stocks continue to lead the broader market higher. Without them, who knows where the stock market would be!! Today’s chart highlights Tech’s leadership, along with it’s long-term rising trend. Below you will see a “weekly” chart of the Nasdaq Composite. As...
