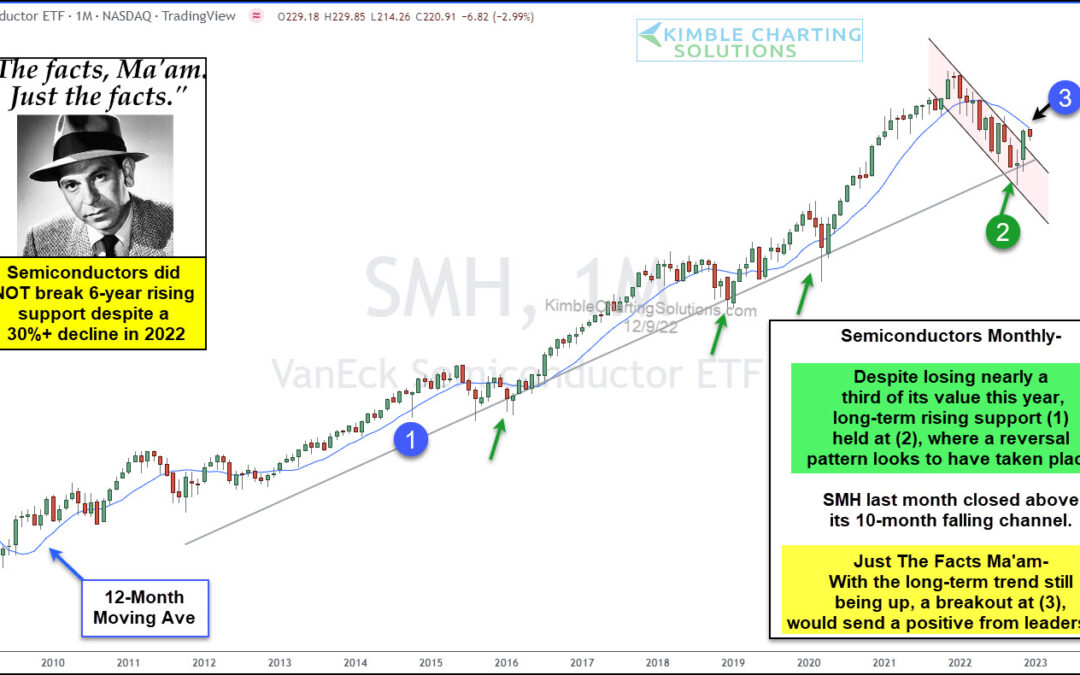
by Chris Kimble | Dec 8, 2022 | Kimble Charting
Technology stocks lead the broader stock market on the way up… and, more recently, on the way down. And within the technology arena, the same is true for the Semiconductors Sector (SMH). To better understand the market’s direction (or change of direction) we watch the...
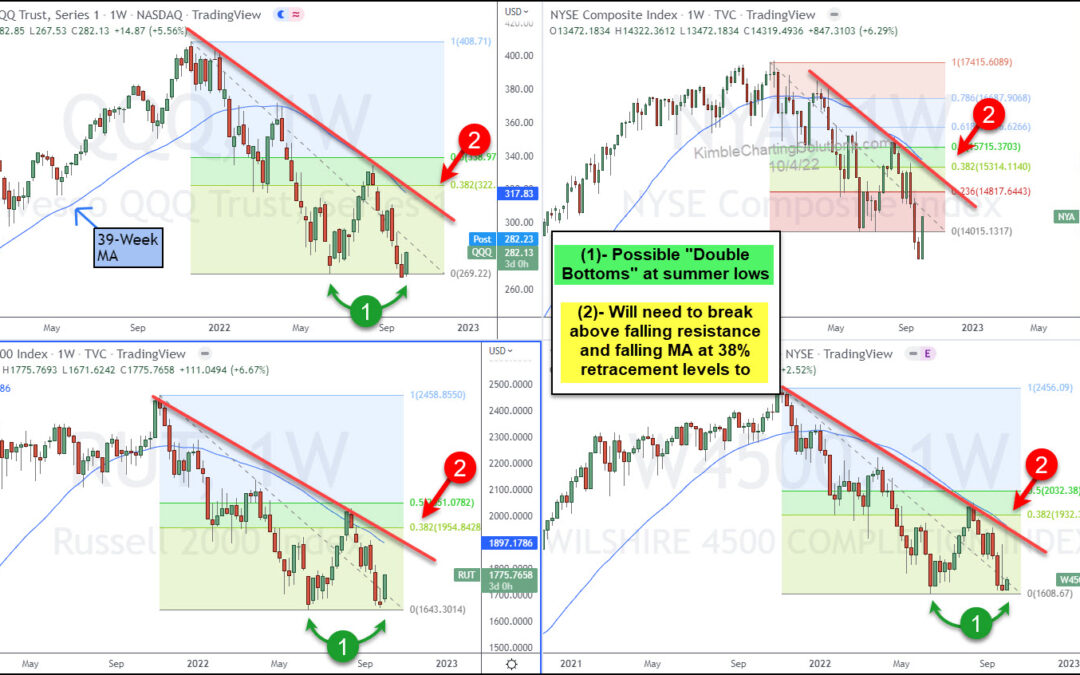
by Chris Kimble | Oct 6, 2022 | Kimble Charting
With stock markets in deep declines, traders need to stay cautious and adhere to their plans. As the same time, it is smart to identify potential technical patterns and what if scenarios to help identify potential trend changes. Today, we look at a chart 4-pack to...
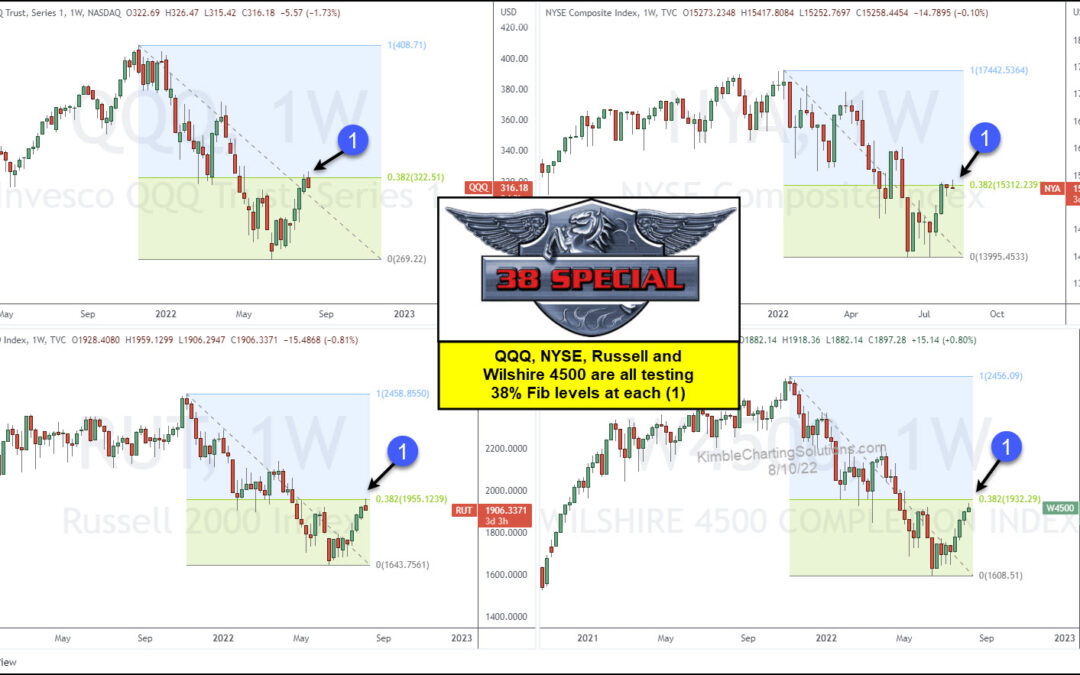
by Chris Kimble | Aug 11, 2022 | Kimble Charting
As the stock market bounce continues, wary investors are beginning to wonder about how much longer this rally will last. While no one can predict the future, we can utilize technical tools to gauge the rally’s health. Today we highlight a key Fibonacci...
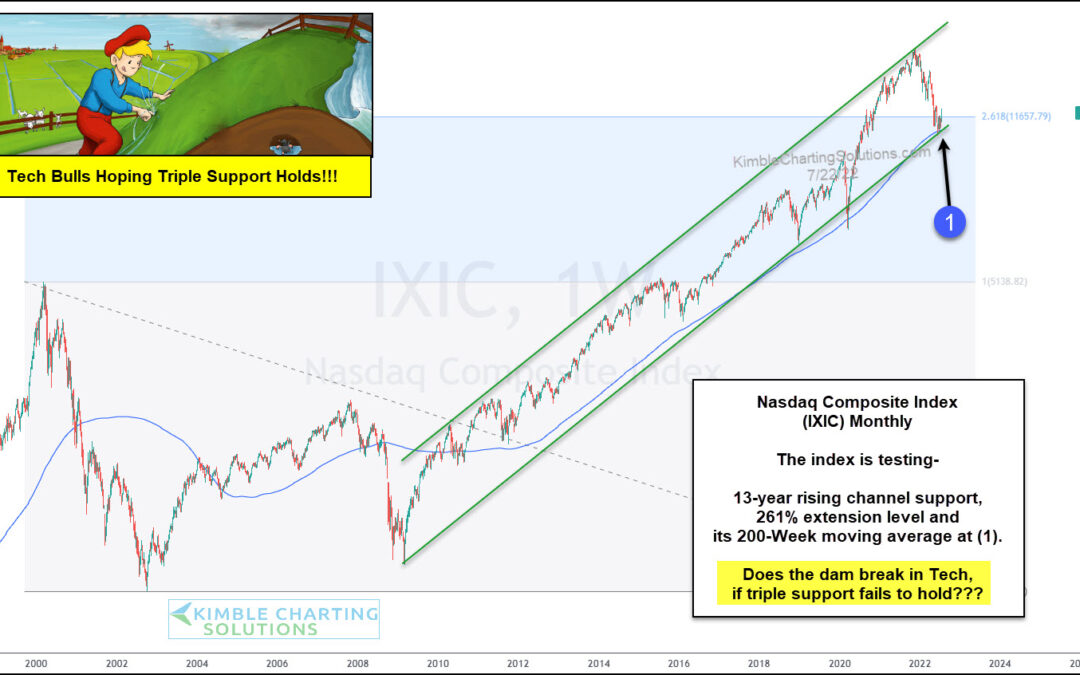
by Chris Kimble | Jul 26, 2022 | Kimble Charting
The major stock market indices have spent much of the first half of 2022 engulfed in a bear market that has eaten away any investor gains experienced last year. Stock market bulls are anxious that a trading low is forming but recent volatility has clouded short-term...
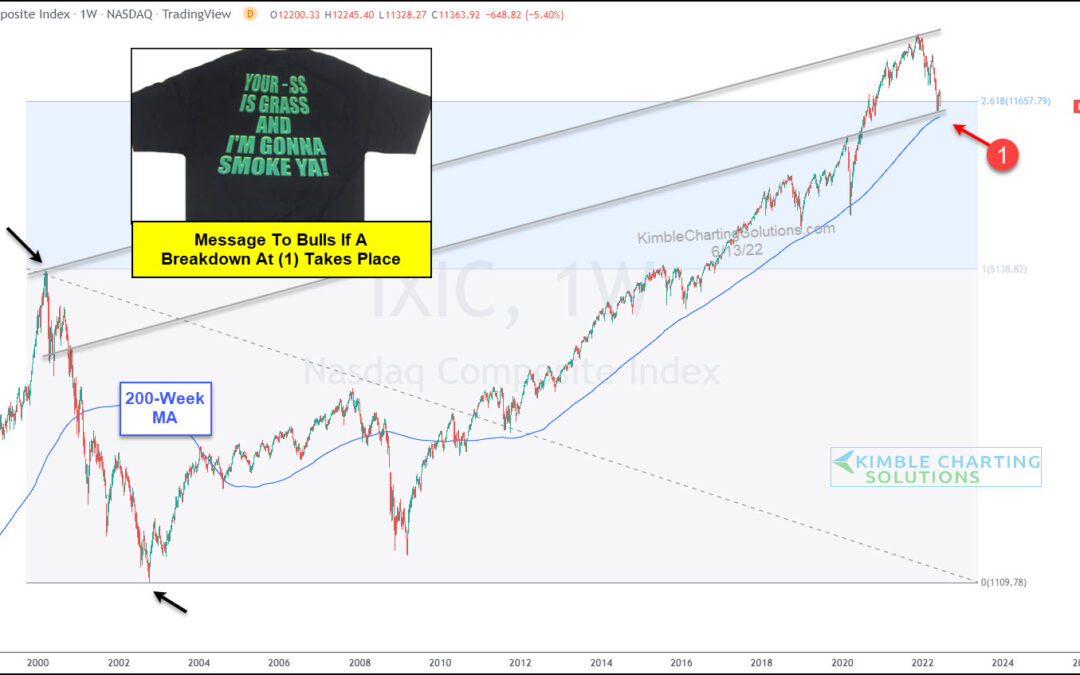
by Chris Kimble | Jun 14, 2022 | Kimble Charting
Technology stocks have been the market leader for the past 13 years. But what leads on the way up, often leads on the way down. And with inflation and rising interest rates, it’s the growth-oriented technology sector that is getting hit the hardest. Today we look at a...
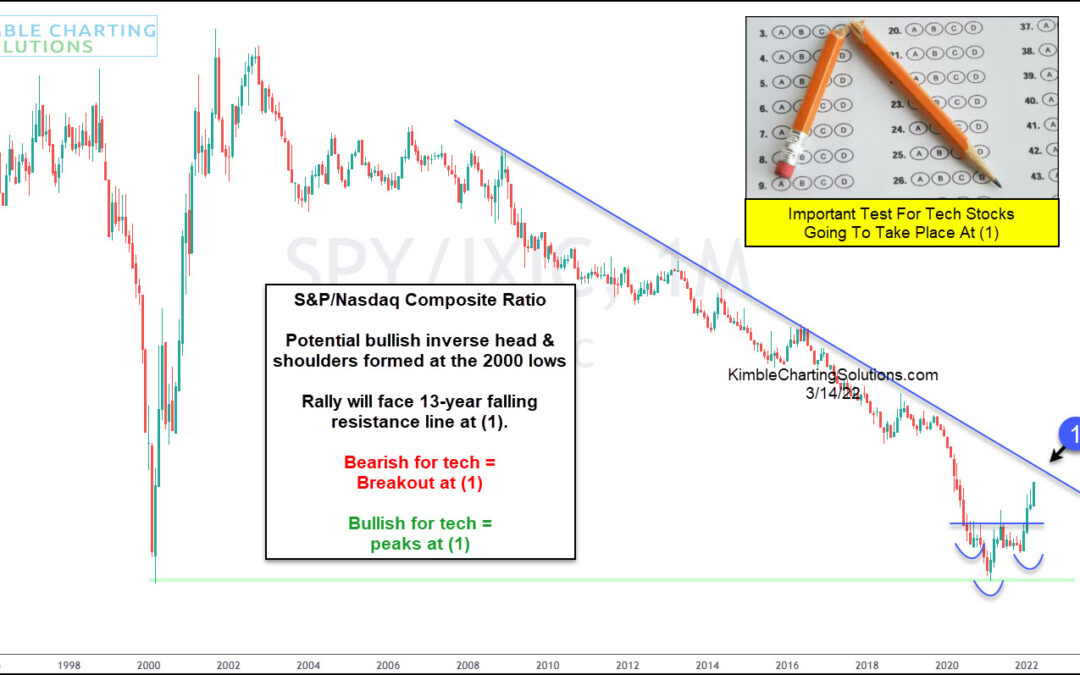
by Chris Kimble | Mar 15, 2022 | Kimble Charting
Over the past several months, growth stocks have begun to fall behind value stocks. And this theme can easily be seen in the growth-oriented Nasdaq Composite. Technology stocks have been a market leader for much of the past two decades. But this trend/theme appears to...
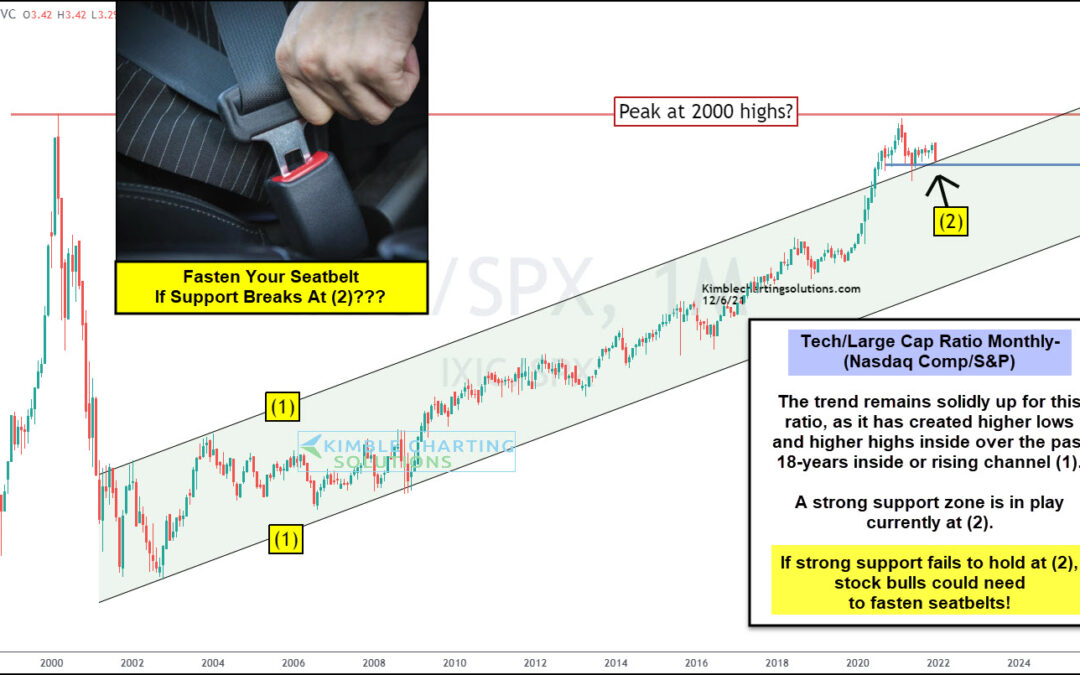
by Chris Kimble | Dec 8, 2021 | Kimble Charting
The U.S. economy and stock markets have been lead by technology companies (and stocks) for nearly 20 years. And this dynamic is on full display in today’s chart. Below is a long-term “monthly” ratio chart of the Nasdaq Composite to S&P 500 Index. In short, if this...
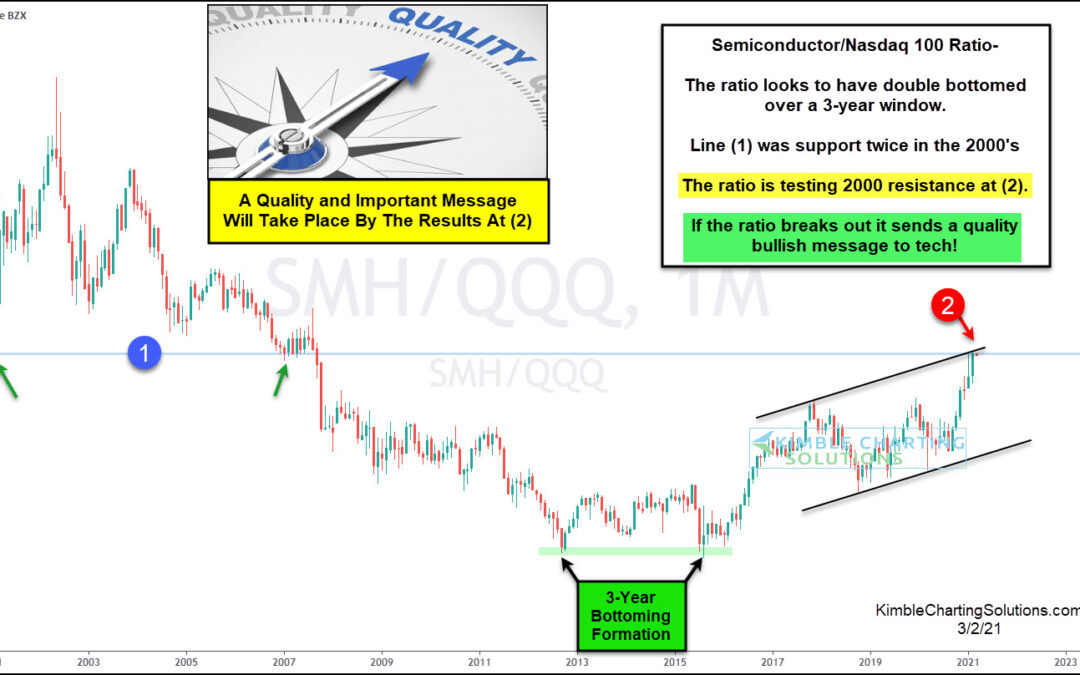
by Chris Kimble | Mar 2, 2021 | Kimble Charting
After years of underperformance, the Semiconductors Sector (SMH) turned the tables in 2016, becoming a market leader. And today, the Semiconductors are looking to further cement that leadership role. Today’s long-term “monthly” chart highlights the ratio of...
