
CLICK ON CHART TO ENLARGE
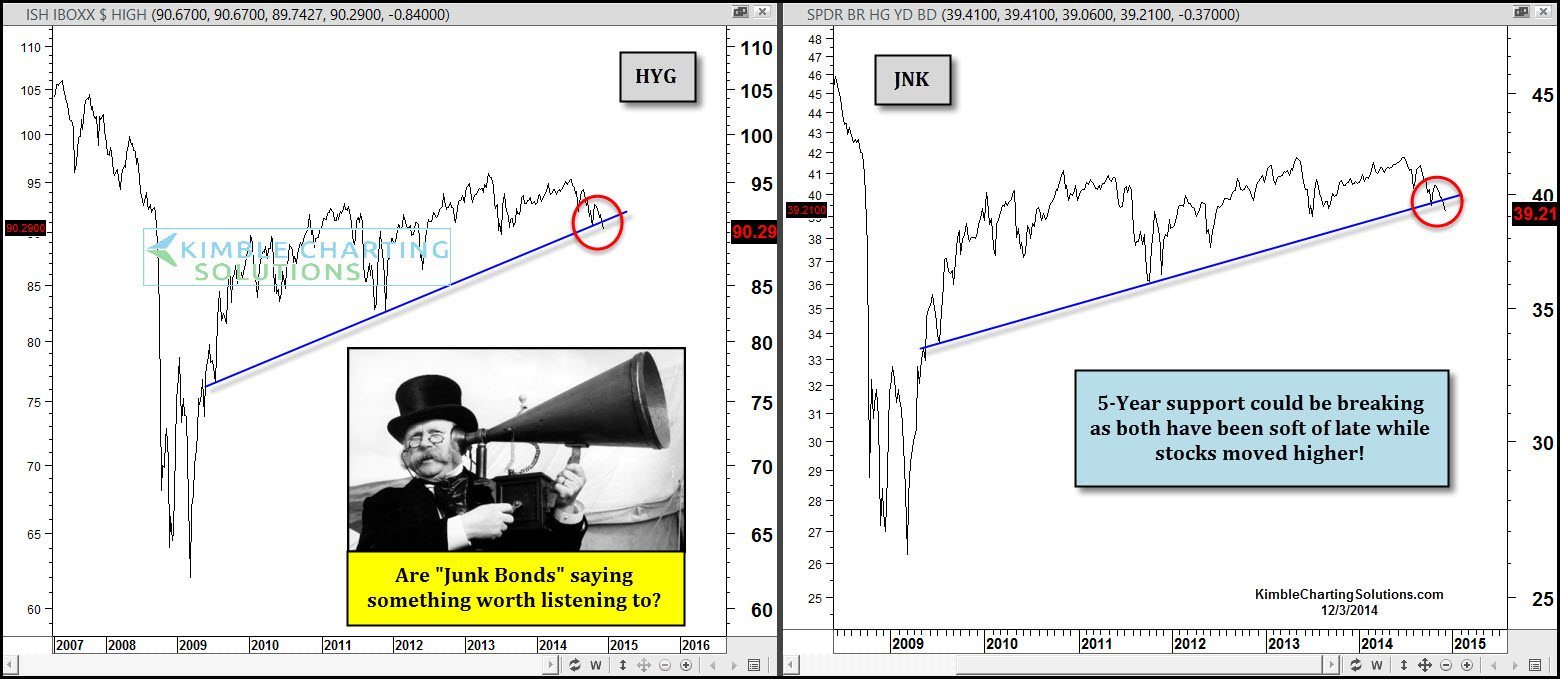
Many feel investors should “listen” to the message coming from Junk Bonds, due to them sometimes being a leading indicator for the stock market.
The 2-pack above takes a look at the two largest Junk Bond ETF’s. JNK and HYG could be breaking 5-year support, as they have been a little soft of late, while the S&P 500 has hit all-time highs.
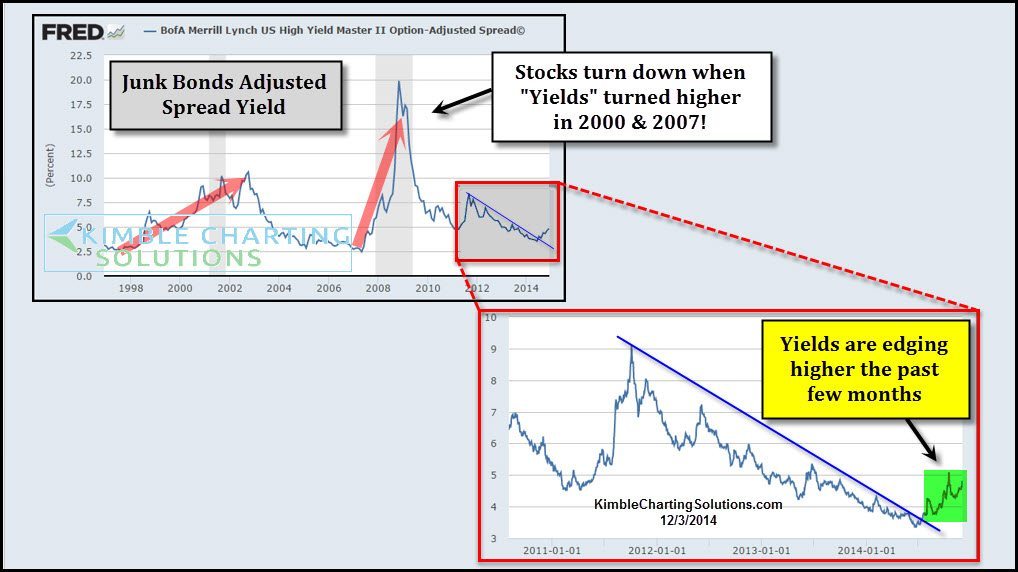
Another way to look at Junk Bonds is to look at yields versus prices. The chart below comes from Federal Reserve of St. Louis
CLICK ON CHART TO ENLARGE
When yields started moving higher back in 2000 & 2007 (upper left chart), junk bonds and the S&P 500 turned soft. From 2011 to a few months ago, yields continued to fall, which is often a good message for stocks.
The lower right chart reflects that yields have recently turned higher, breaking above a falling resistance line.
Are Junk Bond ETF’s sending an early cautionary message to the stock market? I DO NOT believe that investors should adjust portfolios solely upon the action of junk bonds.
Should further weakness take place in this complex and our Shoe Box indicator and the Advance/Decline line turn down at the same time, then I would feel the message from the Junk Bond complex would be worth listening to!
–
–
See our website…..Here
–

Excellent Chart
What is your call on the impact ECB Action/inaction and Jobs report may have on HYG/JNK this week.
Seems to be there is a somewhat divergent force in play that the stronger the dollar the weaker oil could get and that sort of plays on Energy Junk Bonds collateral and weakens JNK/HYG while the stronger dollar attracts foreign capital as well. I am concerned about 4’th Q Profit Margins given strong dollar for the Multi-National Blue chip names that many investors have rotated into and are supporting the market!