
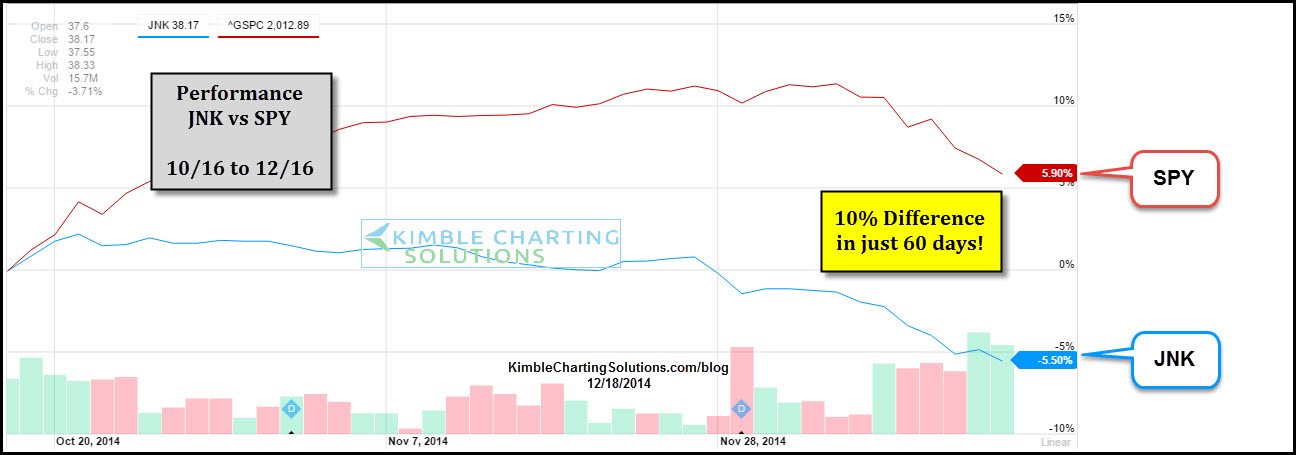
If one likes the idea of buying low and selling higher, junk bonds might come to mind due to how hard they’ve been hit of late! The chart below highlights that an unusual and large performance spread between JNK and the S&P 500. Its not often that these two see a 10% return difference in just 60 days. This differential wasn’t the only thing that got my attention though…..see comments below.
CLICK ON CHART TO ENLARGE
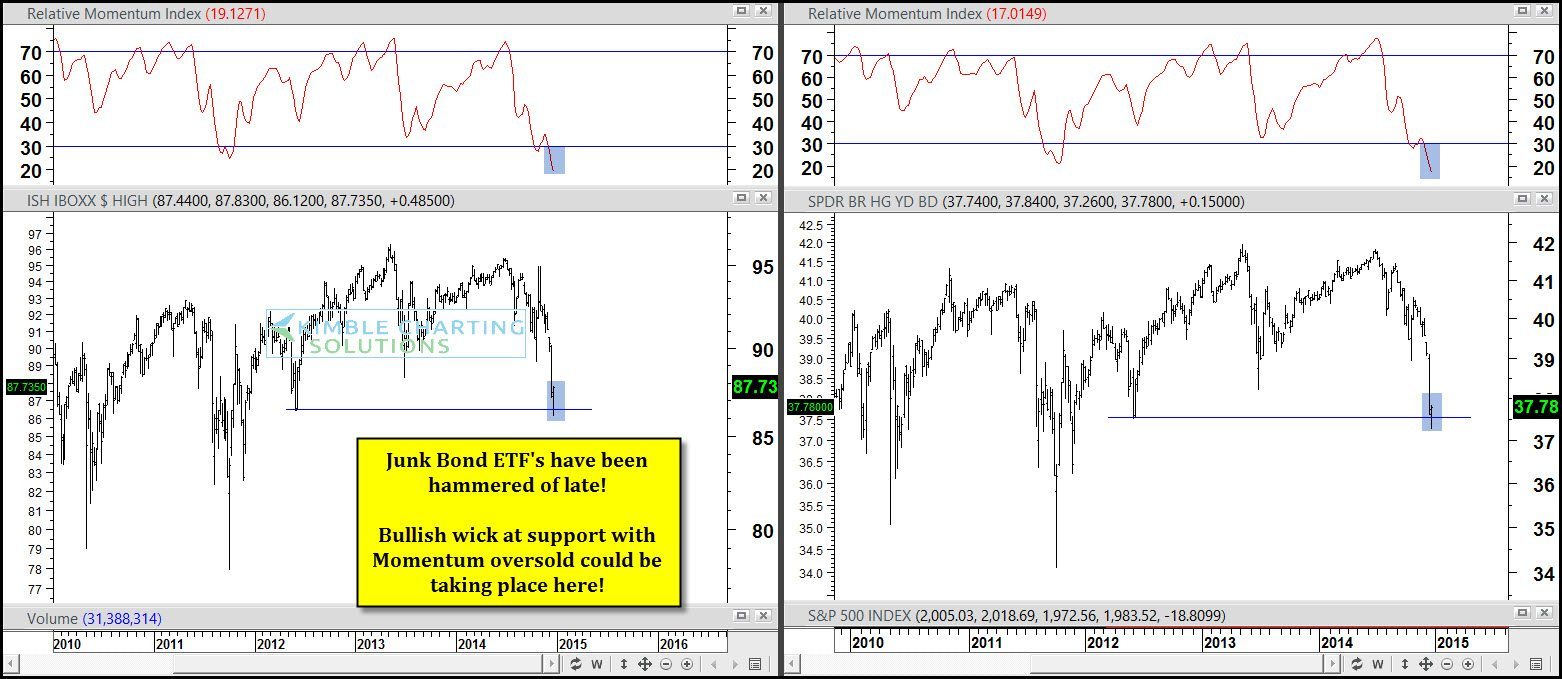
At the same time junk was doing so poorly, the decline took both JNK & HYG down to levels not seen since 2012 and momentum is the most oversold in the past 5 years.
Premium members bought JNK because of these conditions mentioned above, as JNK was creating bullish wicks at 2012 levels. Junk bonds are often viewed as leading indicators for the broad market and these bullish wicks were nice to spot after such a rare performance spread was at hand.
This opportunity was also shared on Stocktwits yesterday. (see here) Would be honored if you would follow me along with others at this cool site. (Here)
–
–
See more of our research at Kimble Charting Solutions
–
