

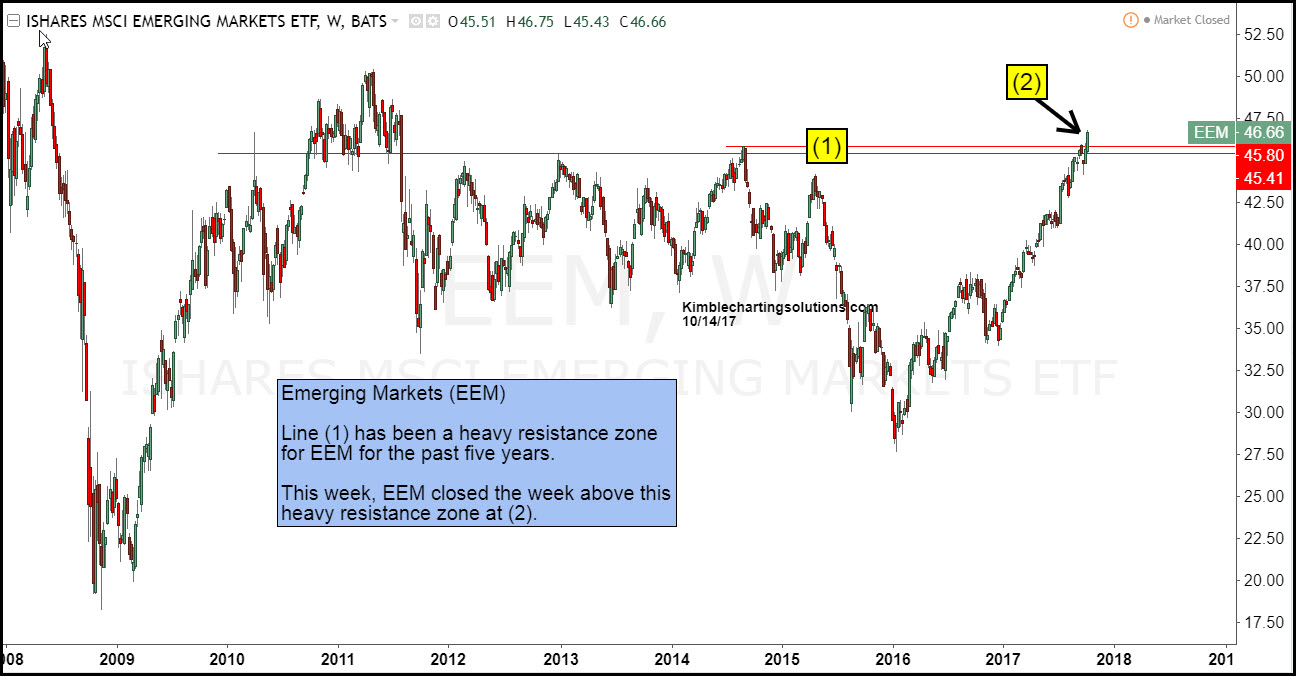
Emerging Markets ETF (EEM) did something this week, it has been unable to do numerous times over the past 5-years. Below looks at the price pattern of EEM over the past 10-years.
CLICK ON CHART TO ENLARGE
EEM has done well since the start of 2016, reflecting gains much stronger than the S&P 500. Over the past 5-years, EEM has little to brag about, as the gains have been pretty much non-existent!
This week EEM was able to put in a “Weekly Close” above highs at resistance zone (1) above. This breakout is a positive price signal and could attract buyers due to the breakout.
Next key upside test for EEM come in at the $50 zone, around 10% above current prices.
