
by Chris Kimble | Sep 23, 2014 | Kimble Charting
CLICK ON CHART TO ENLARGE The above 6-pack update the patterns on some of the larger stock markets around the world. As you can see Germany and the S&P 500 are these strongest of this set, as both are well above their highs reached in 2000 & 2007. As...

by Chris Kimble | Sep 3, 2014 | Kimble Charting
CLICK ON CHART TO ENLARGE The Power of the Pattern has been keeping an eye on China ETF FXI, as it approached 6-year falling resistance a couple of months ago. Members bought FXI near resistance with a tight stop, looking for a potential breakout. Of late, FXI...

by Chris Kimble | Aug 12, 2014 | Kimble Charting
CLICK ON CHART TO ENLARGE Over the past few years, Europe has had strong rallies, which have formed rising wedges. Two thirds of the time this pattern leads to lower prices. Of late support lines could be breaking in France, London & Germany. On the...

by Chris Kimble | Jul 23, 2014 | Kimble Charting
CLICK ON CHART TO ENLARGE Many major stock index’s in the United States and Europe are either at all-time highs or near them. One sixth of the worlds population can’t make the same statement though! The chart below reflects that the Shanghai Index...

by Chris Kimble | Jun 12, 2014 | Kimble Charting
CLICK ON CHART TO ENLARGE The Shanghai Index looks to be creating a multi-year descending triangle pattern. A little over 50% of the time the asset that forms this pattern, ends up falling in price. When support breaks, over 75% of the time a meaningful decline...

by Chris Kimble | Jan 28, 2014 | Kimble Charting
CLICK ON CHART TO ENLARGE My Mentor, Sir John Templeton, was a strong believer in “buy at the point of maximum pessimism!” Unless you live under a rock, you are well aware that Emerging markets have not only had a few rough years, they’ve also...
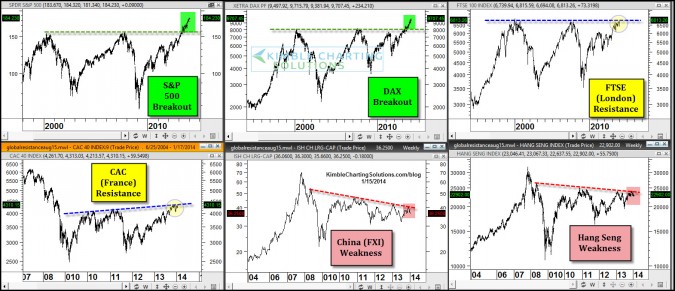
by Chris Kimble | Jan 15, 2014 | Kimble Charting
CLICK ON CHART TO ENLARGE The above 6-pack reflects some of the key global markets and where they stand from a pattern perspective. Strength is taking place in the S&P 500 & Dax as breakouts above 2000 & 2007 highs continue. Key resistance is...

by Chris Kimble | Dec 4, 2013 | Kimble Charting
CLICK ON CHART TO ENLARGE The Nikkei Index and the China ETF (FXI) have something in common…”they’ve been here before!” Been where? Both have hit falling resistance line (1) several times over the past few years, Nikkei since 1996! Its...
