
The S&P 500 pullback (last week) feels like a distant memory following the stock market’s 2-day snapback rally.
But investors should take note of what’s happening under the surface for two important market indexes: the S&P 500 Index (SPX) and the Bank Index (BKX).
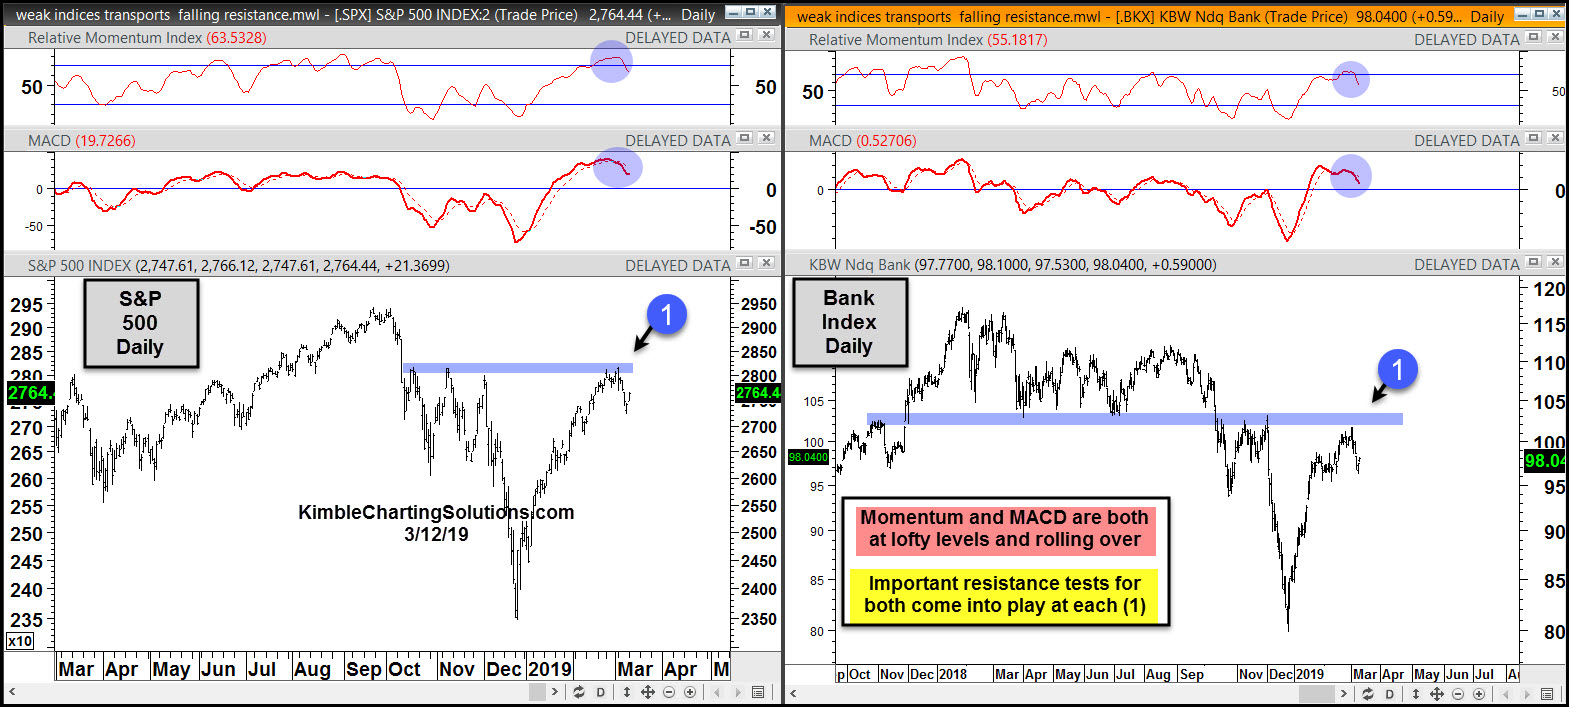
In today’s 2-pack chart, we look at both indexes and highlight an emerging concern.
Looking at the chart below, we can see that last week’s pullback also saw MACD and Momentum indicators move lower from lofty levels.
This comes at the same time that the S&P 500 and Bank Index are testing important resistance at each (1). This could lead to either an outright failure or a divergence if price makes marginal new highs but momentum does not.
Is the 2-month rally about to run out of gas around each (1)! Stay tuned!
This article was first written for See It Markets.com. To see original post CLICK HERE
–
