
After peaking in 2021, copper prices declined sharply before bouncing around for a few years. That “bouncing” ended up following the twists and turns of Fibonacci rules.
And we can see this in today’s “weekly” chart of Copper.
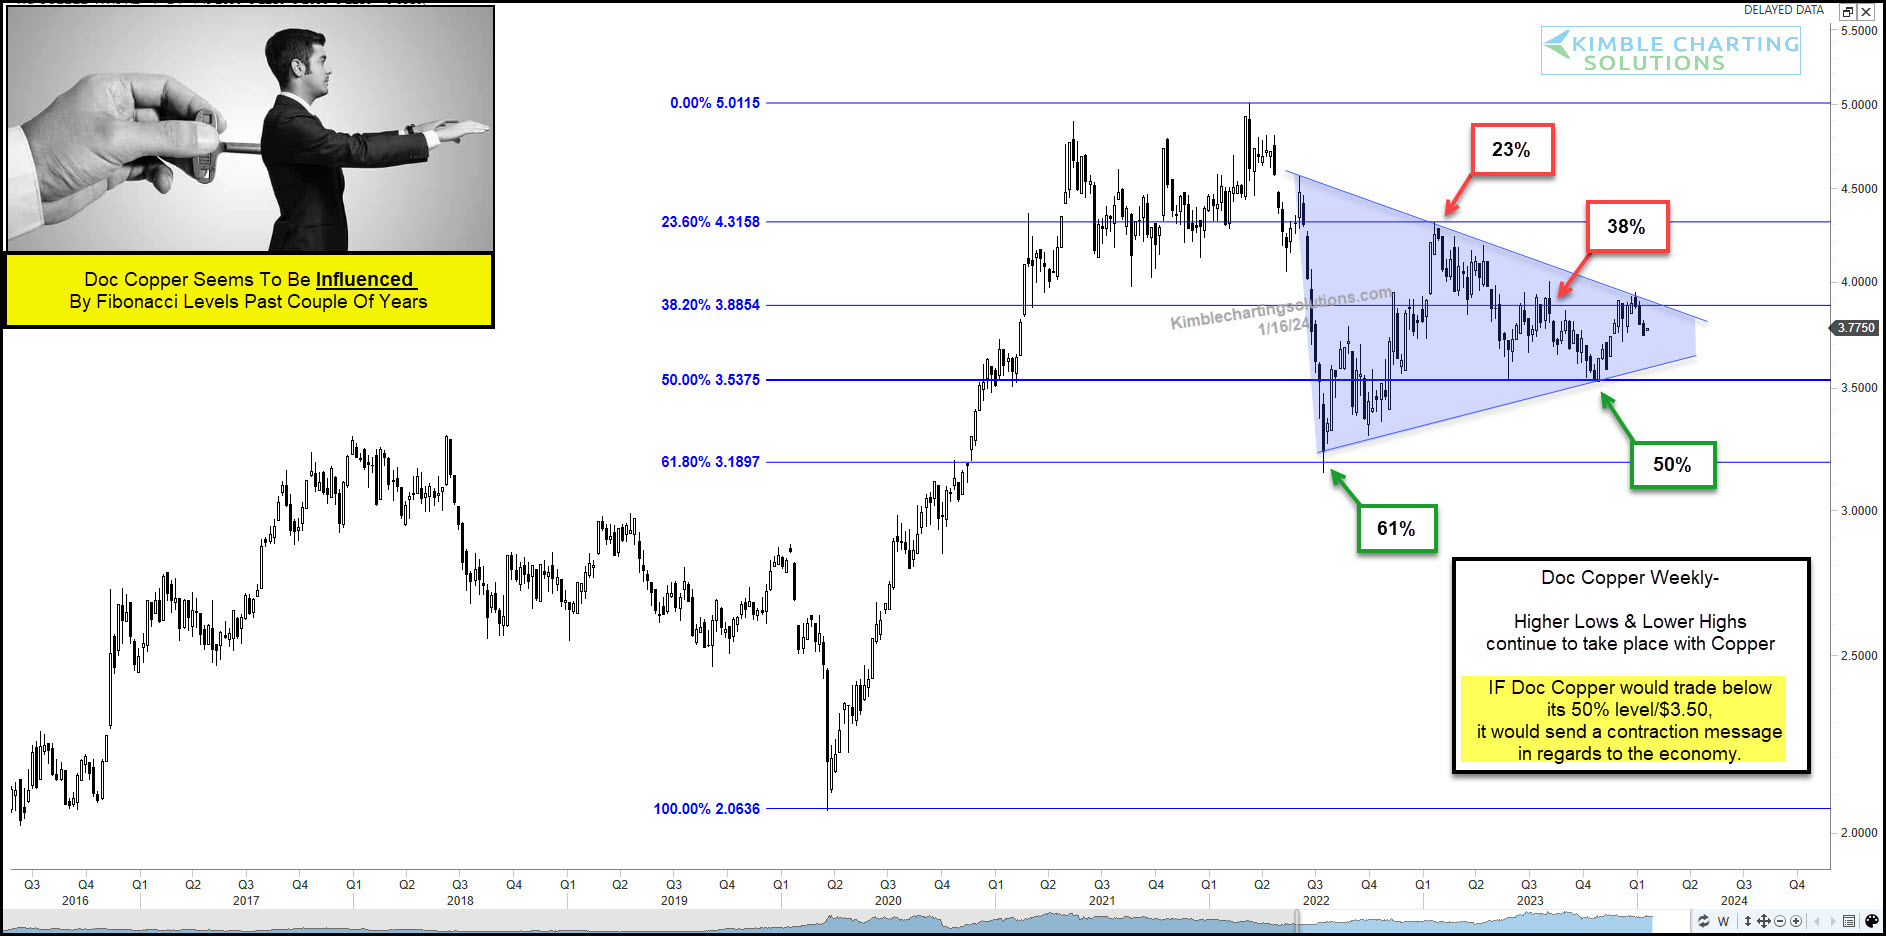
Yes, Doc Copper seems to be under the influence of Fibonacci.
The initial decline hit the 61% Fib before bouncing to the 23% Fib. After a touch of the 38% Fib, Copper fell to the 50% Fib… before bouncing again.
All of this price action ended up forming a large pennant pattern. And when Copper finally breaks from this pennant pattern, it will send an important macro decision the broad market. A breakout would be bullish for the economy, while a breakdown would be bearish. Stay tuned!
This article was first written for See It Markets.com. To see the original post, CLICK HERE.
