
Although copper isn’t the economic bellwether that it was 50 years ago, it is still an important barometer of economic activity.
As you can see in today’s chart, Copper fell sharply into the 2020 coronavirus crash before racing higher and rallying just as sharply with the economic recovery into late 2021.
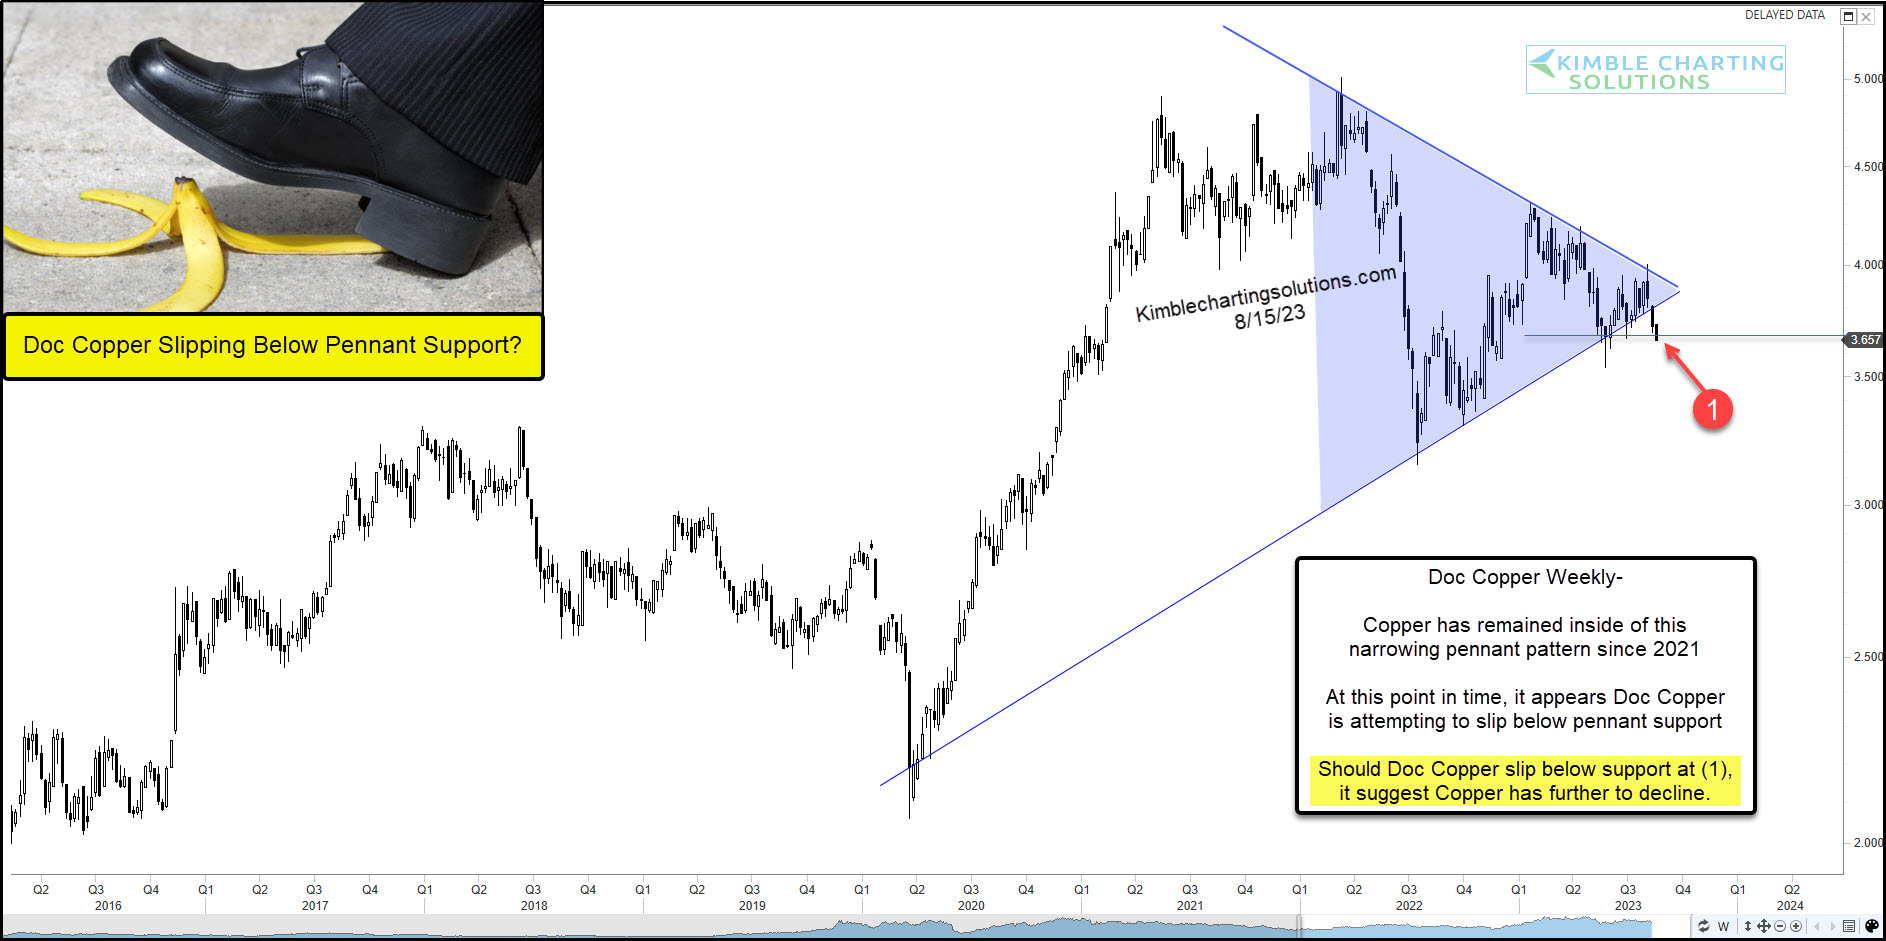
BUT, copper has struggled since then, falling sharply into 2022 before recovering some.
Today’s “weekly” chart of Doc Copper highlights the pennant pattern that formed since that peak. It also shows that Copper is attempting to break below pennant support at (1).
Should it break below support at (1), it would suggest Doc Copper has further to go on the downside. It may also suggest further economic stagnation on the horizon. Stay tuned!
This article was first published at See It Markets.com. To see the original post CLICK HERE.
