
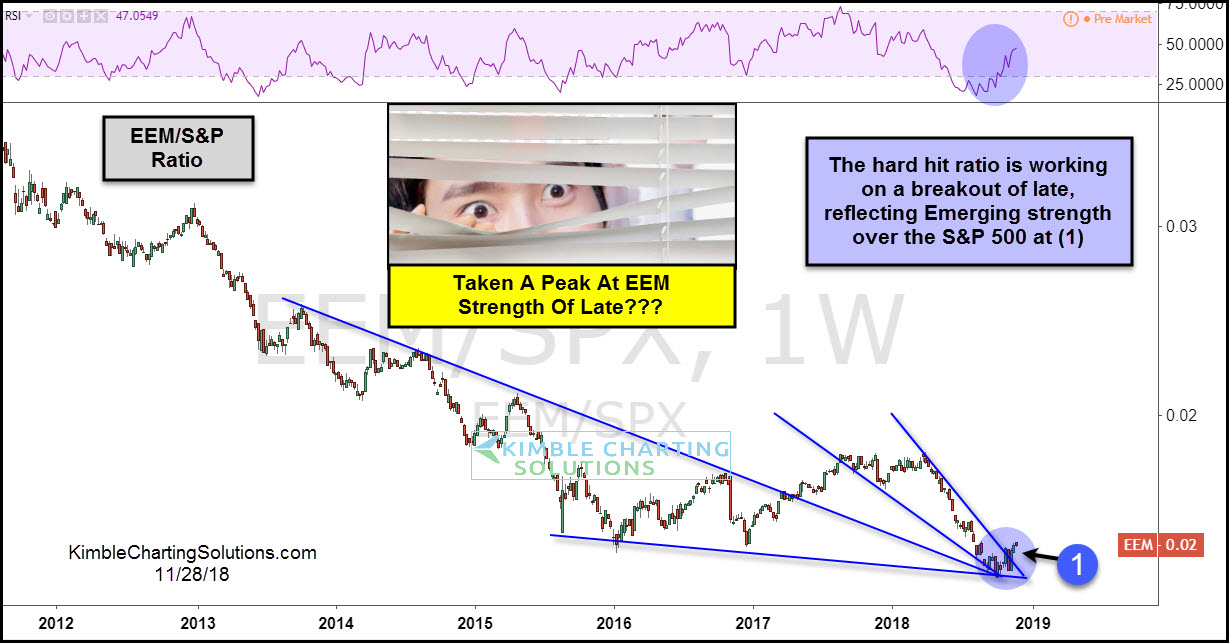
This chart looks at the Emerging Markets ETF (EEM)/S&P 500 ratio over the past 6-years. The decline in the ratio reflects EEM has been much weaker than the S&P 500 since 2012.
A couple of months ago the ratio tested triple support as momentum was hitting the lowest level in the past three years. While the S&P 500 has been rather weak since the first of October, EEM has been a little stronger, causing the ratio to turn up.
The ratio is working on a breakout above a bullish falling wedge at (1). Strength in this ratio sends a short-term bullish message to hard-hit Emerging markets, which could also send a positive message to stocks in the states!
–
