
by Chris Kimble | Mar 18, 2020 | Kimble Charting
Boring Investment Grade bonds could be sending a very important macro message of late! This chart looks at Investment Grade ETF (LQD) on a weekly basis over the past 20-years. LQD formed a bottom in late 2008, several months ahead of stocks. Following the 2008 low,...
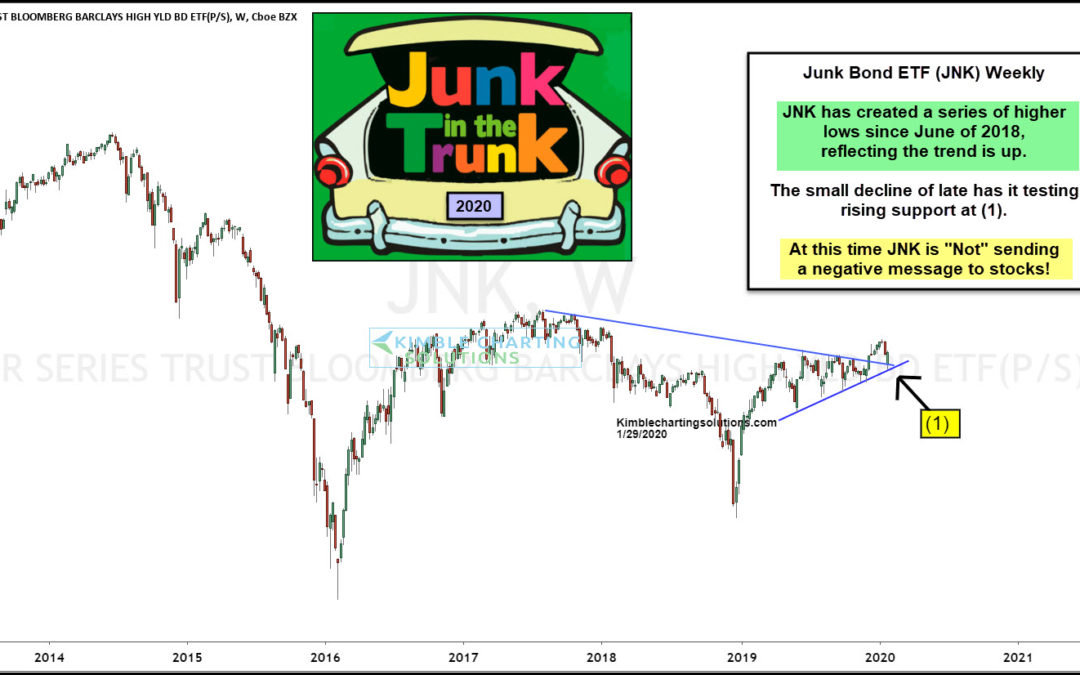
by Chris Kimble | Jan 29, 2020 | Kimble Charting
If the saying “So goes Junk Bonds, So goes stocks” is true, what Junk bonds do in the next couple of weeks could send an important message to stocks! Junk bond ETF (JNK) has created a series of higher lows since June of last year. When JNK moves higher...
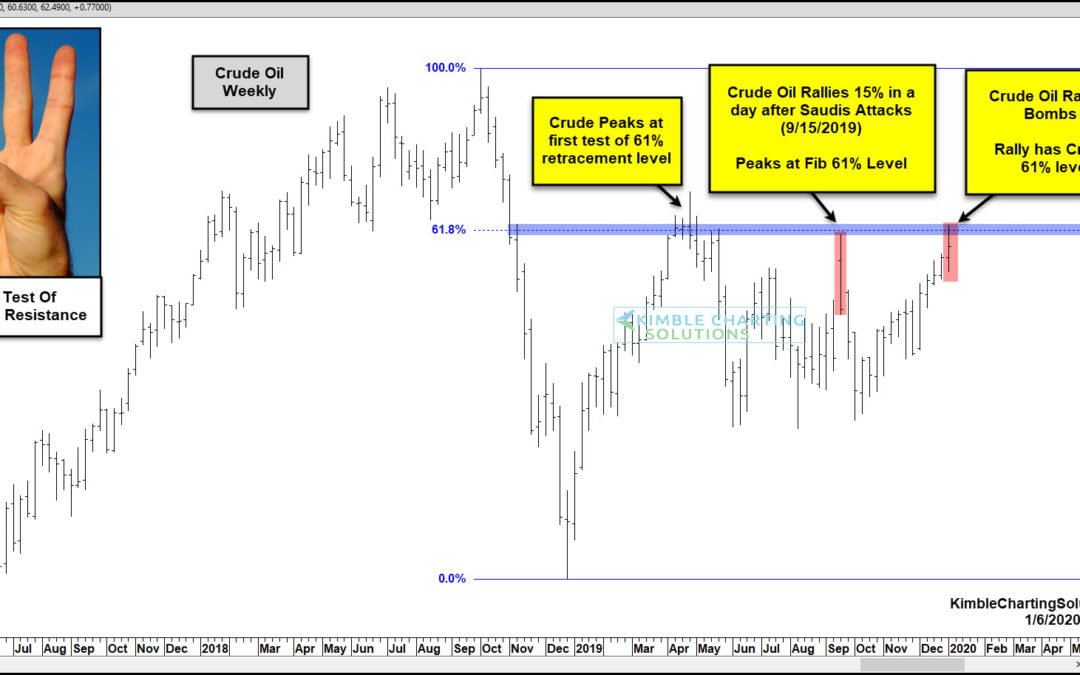
by Chris Kimble | Jan 6, 2020 | Kimble Charting
The Crude Oil rally is gathering momentum as Middle East tensions come to the forefront. The rally has taken crude oil prices to a critical juncture, that two other times became a peak in oil prices. Oil prices are back at a familiar resistance level… a price area...
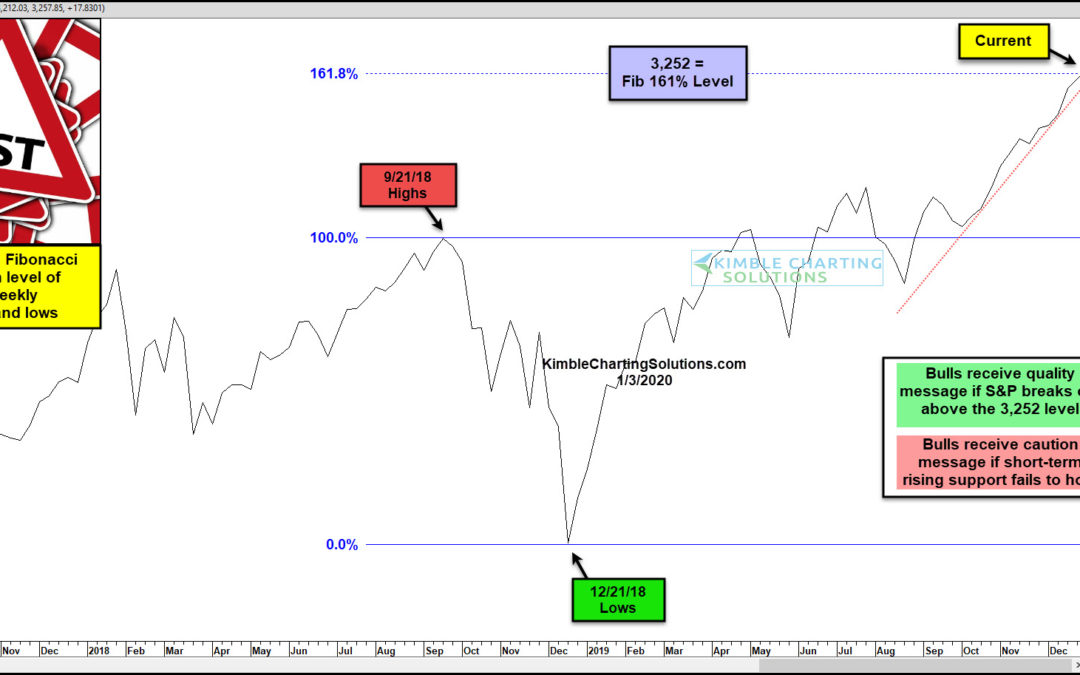
by Chris Kimble | Jan 3, 2020 | Kimble Charting
Is the bull market getting long in the tooth? Could the S&P 500 Index rally be nearing an end? Okay now that we have the bears attention, let’s face the facts: This is a bull market (until proven otherwise). And the bull market isn’t going anywhere until we see...
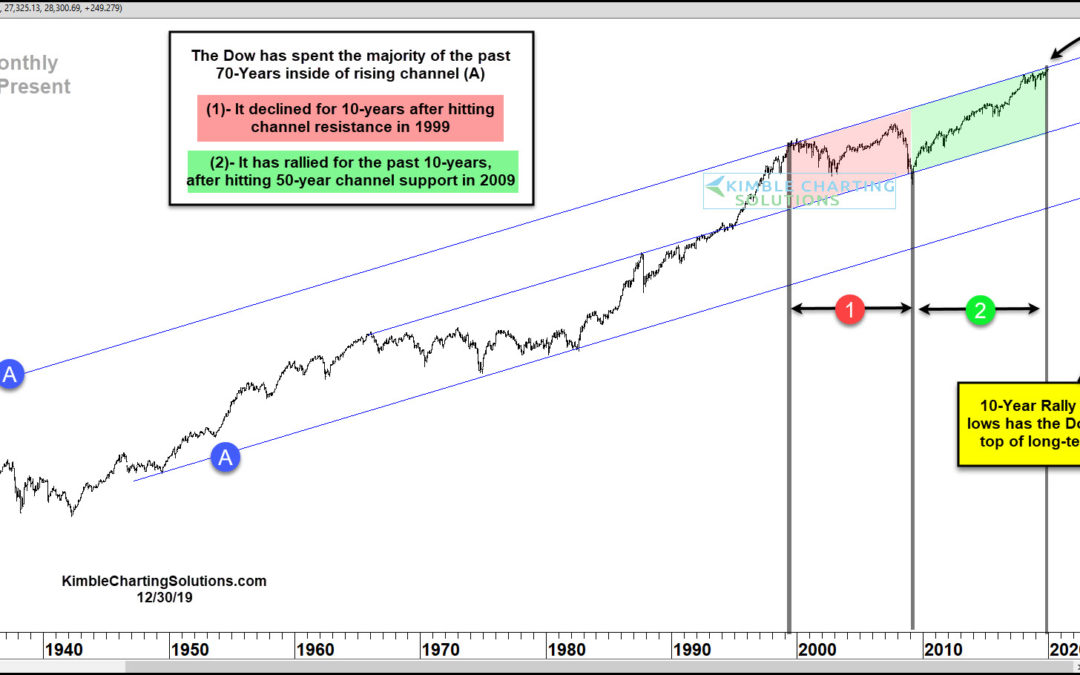
by Chris Kimble | Dec 30, 2019 | Kimble Charting
Sometimes 10-year returns aren’t so hot and sometimes 10-year returns are sizzling hot! This chart looks back on the Dow Jones Index over the past 95-years (since 1925), which highlights that the majority of the past 50-years, the Dow has remained inside of...
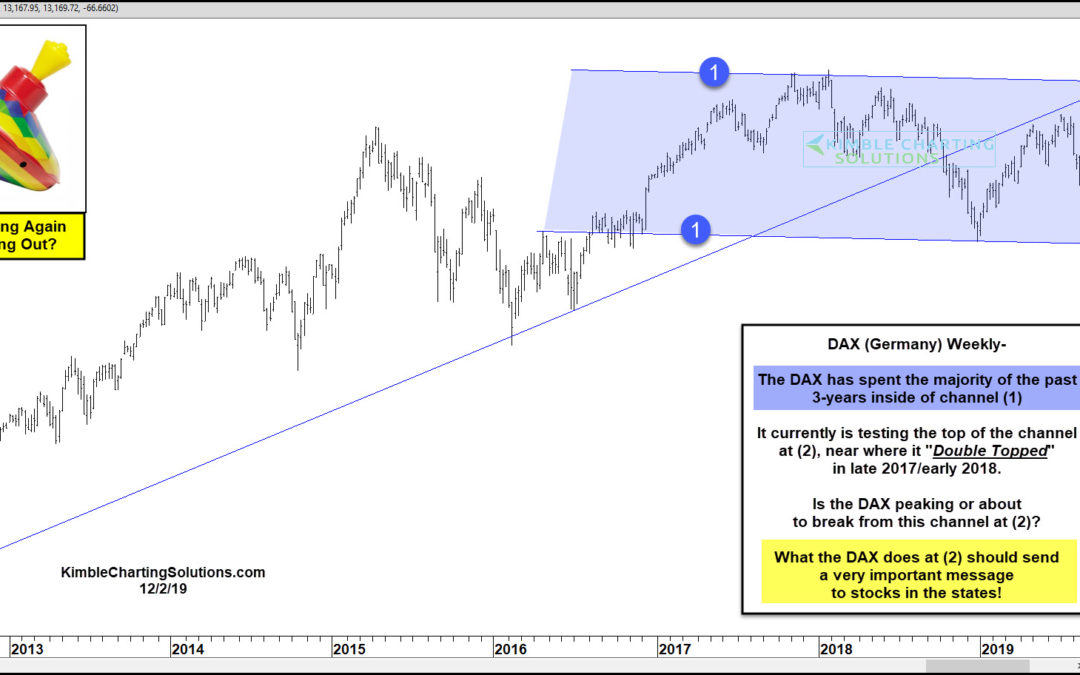
by Chris Kimble | Dec 2, 2019 | Kimble Charting
Is Germany about to send a very important price message to stocks in the states? This pattern would suggest it is! This chart looks at the DAX index from Germany over the past 7-years. As mentioned in the chart above, the DAX has spent the majority of the past 3-years...
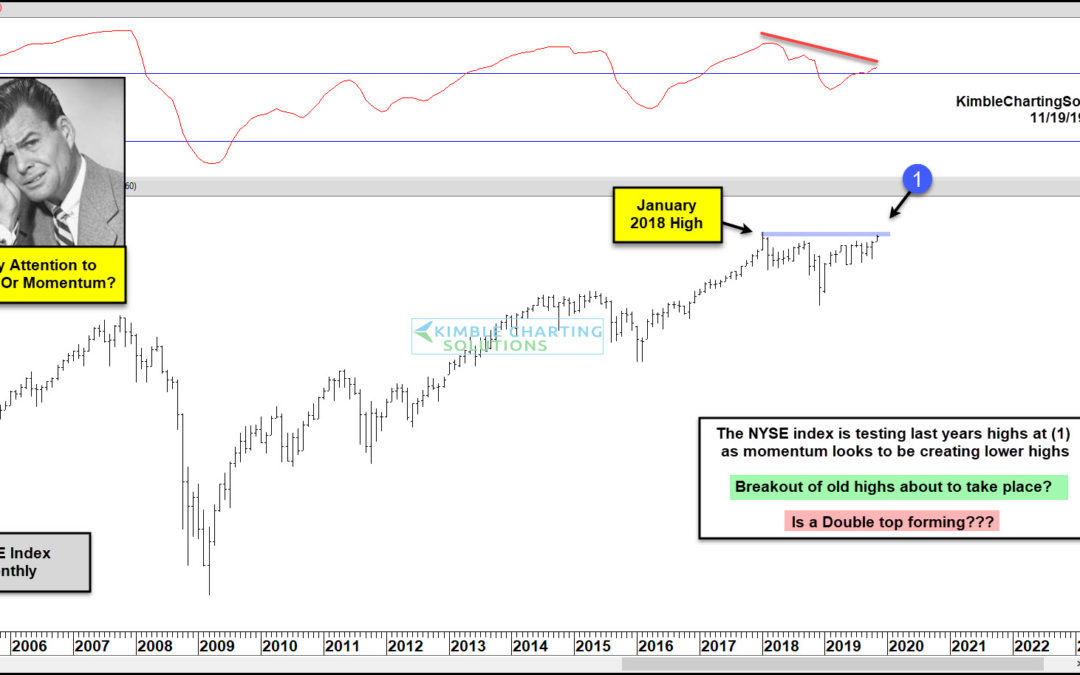
by Chris Kimble | Nov 19, 2019 | Kimble Charting
A very broad index is testing last year’s highs, as monthly momentum is creating lower highs? Which indicator is more important, price or momentum? This chart looks at the New York Stock Exchange Index (NYSE) on a monthly basis over the past 15-years. The index...
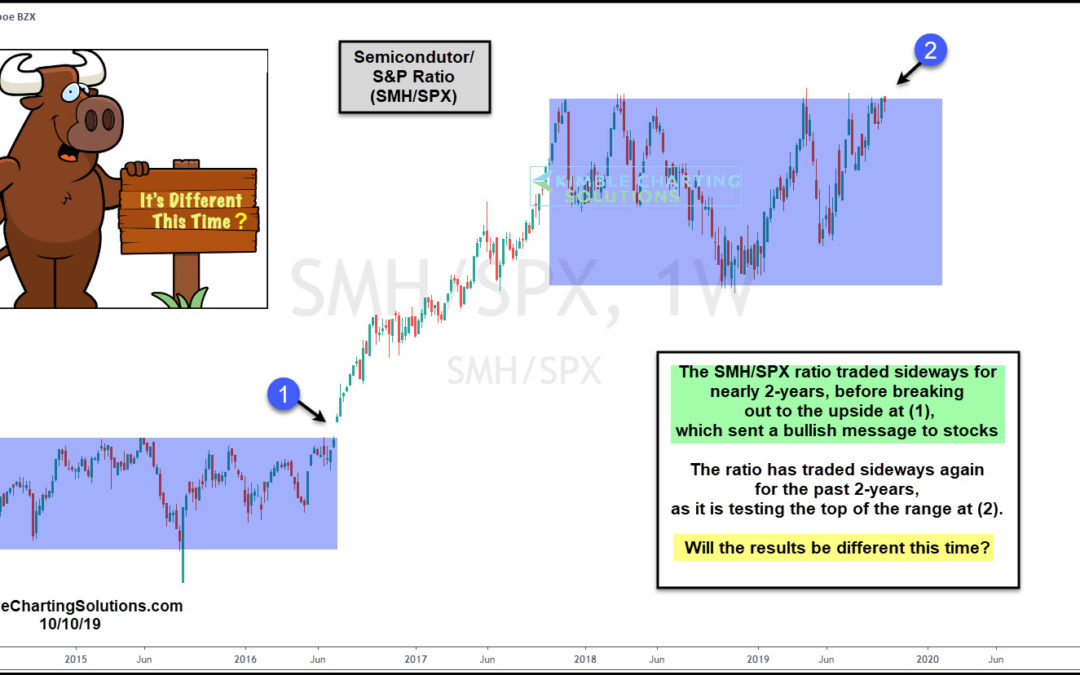
by Chris Kimble | Oct 10, 2019 | Kimble Charting
Sir John Templeton used to say that the four most dangerous words in investing are; “It’s Different This Time.” Investors might want to keep a close eye on this ratio to see if the results will be different this time! This chart looks at the...
