
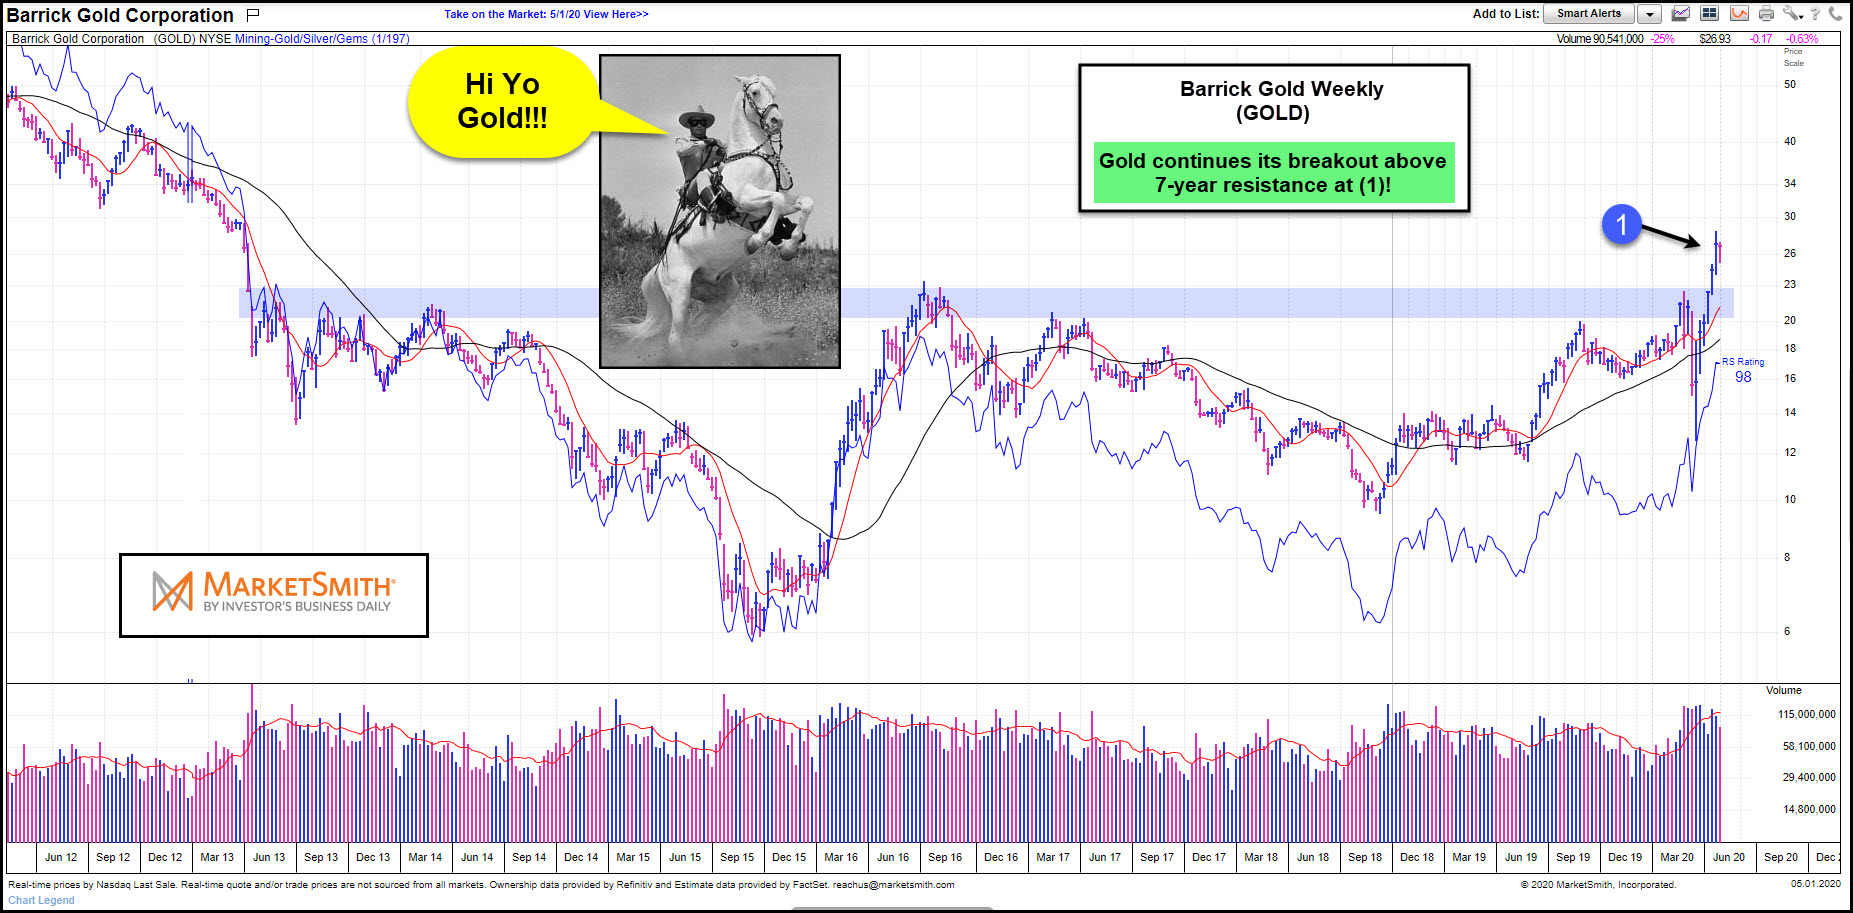
Is it “Hi-Yo Gold” time? At least in the short-term, it is!
This chart looks at Barrick Gold Corp (GOLD) on a weekly basis. Gold has struggled to break above the blue shaded resistance zone for years, which comes into play just below the $23 level.
This chart from Marketsmith.com reflects that GOLD is breaking above 7-year resistance at (1). This breakout sends a bullish message from Gold.
The mother of all mining indices is attempting a triple breakout at the same time!!!
The oldest mining index is the XAU index, which tracks gold and silver mining stocks. This index is attempting to break above the top of a 9-year falling channel and well as three other resistance lines at (1).
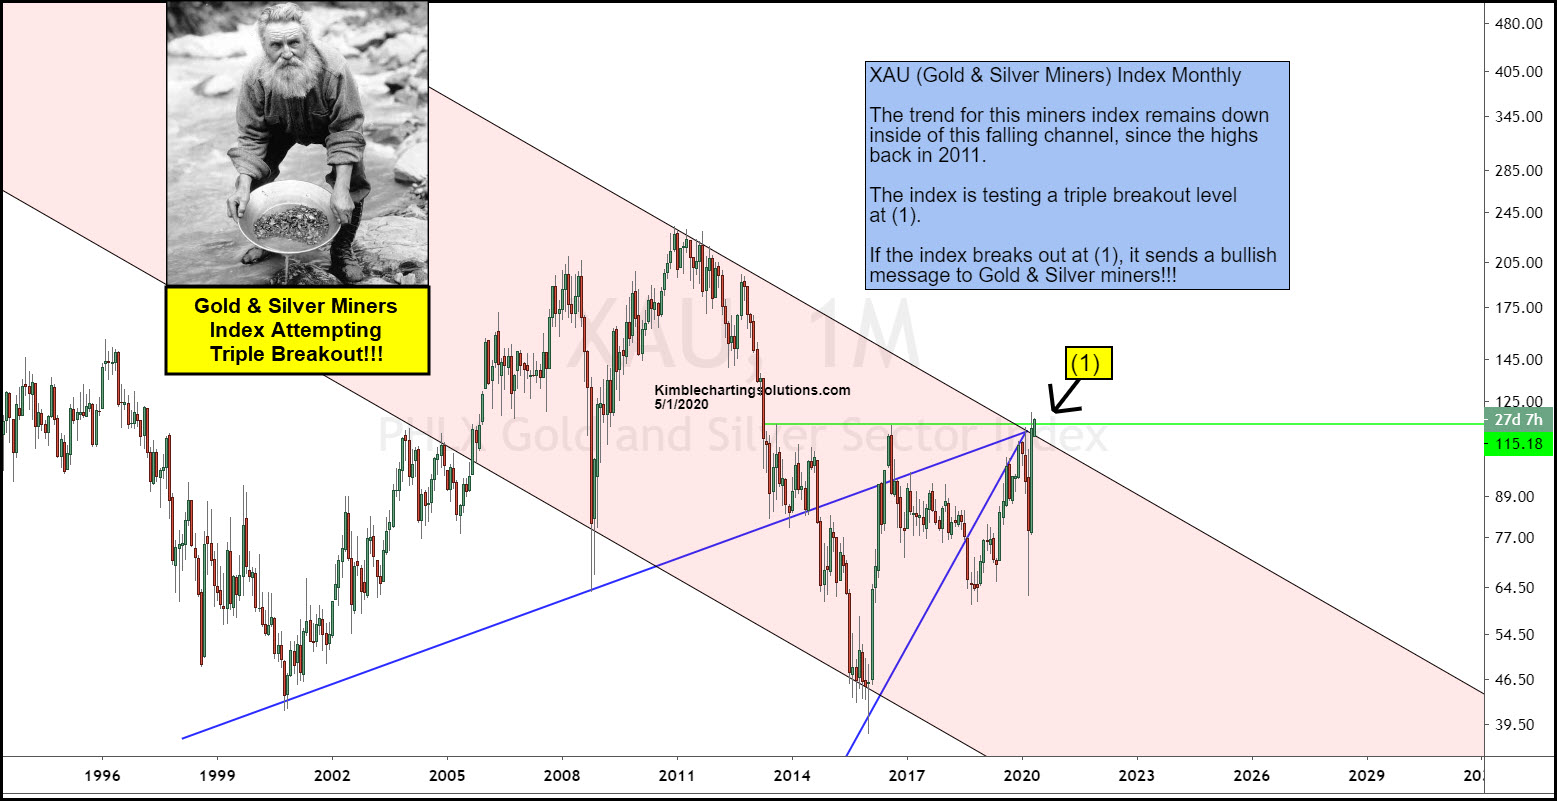
If this index succeeds in breakout out at (1), it sends the first long-term bullish message to miners in years and years!!!
If you have an interest in our finding opportunities in Gold, Silver, Miners, Copper, and Steel you will find our “Metals research reports” of value.
In honor of my 40th anniversary in the business, check out how to receive 40% off our most popular research reports.
