by Chris Kimble | Mar 4, 2020 | Kimble Charting
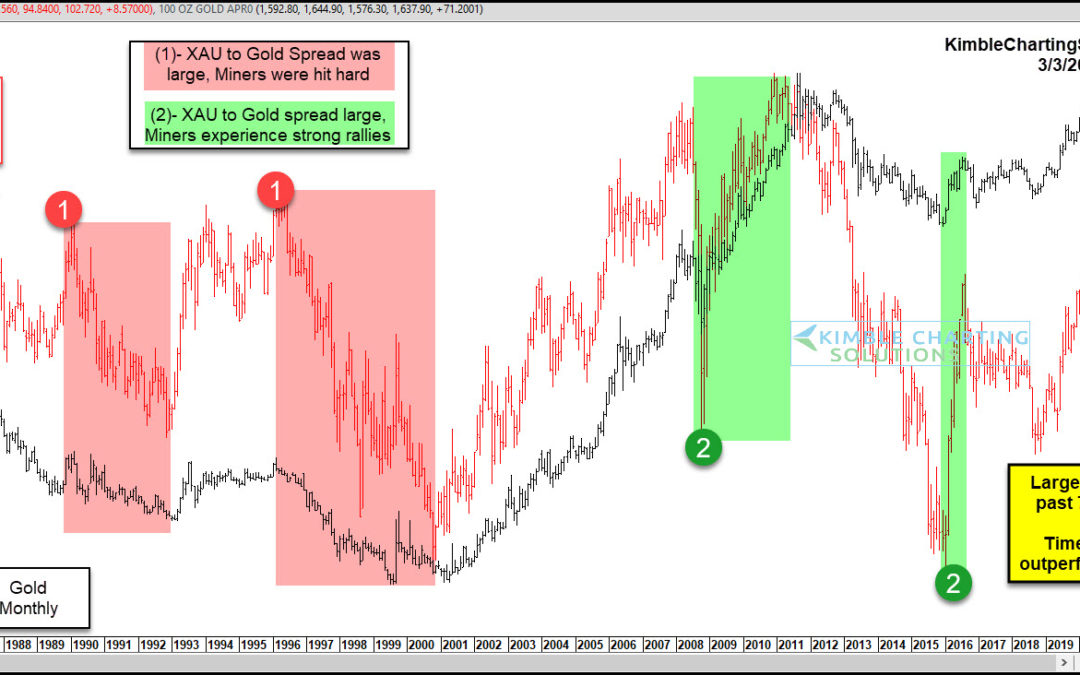
I like to look at price spreads, particularly spreads between related assets. When they become too wide, they point to a strong potential for mean reversion (and an opportunity for investors). Today, we look at the spread between the Gold/Silver Miners Index (XAU) and...
by Chris Kimble | Jan 13, 2020 | Kimble Charting
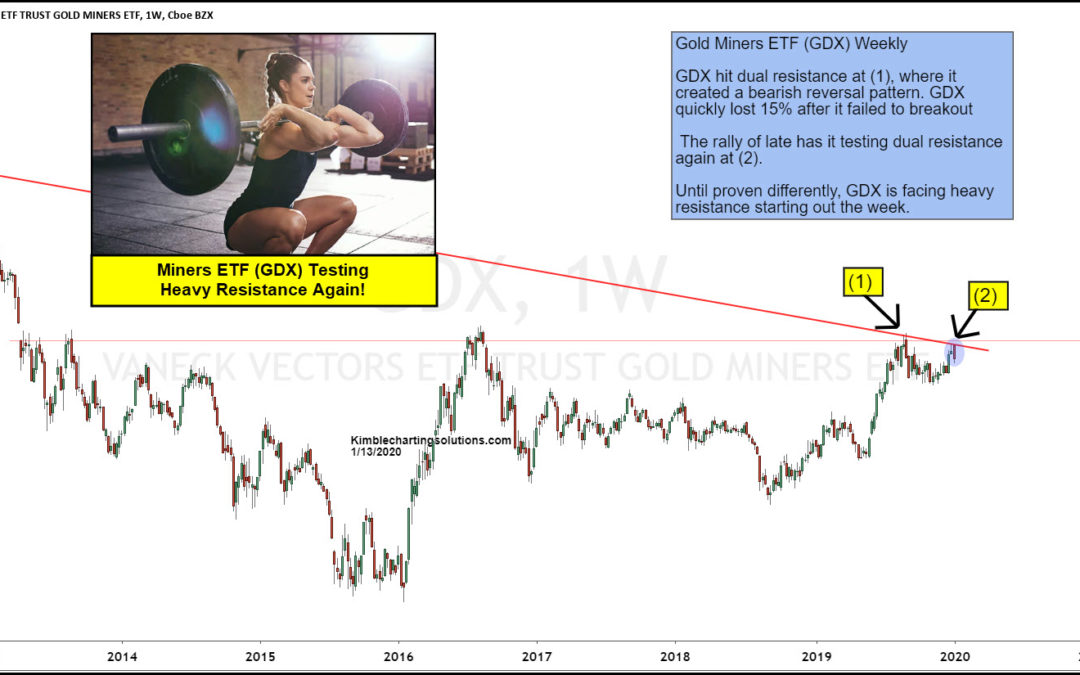
In September of 2019, Gold Miners ETF (GDX) testing long-term resistance at (1), and then it quickly declined 15%. This resistance level has been heavy for GDX has it failed to break above this level twice in 2013 and once in 2016. Each time GDX peaked in those years,...
by Chris Kimble | Dec 6, 2019 | Kimble Charting
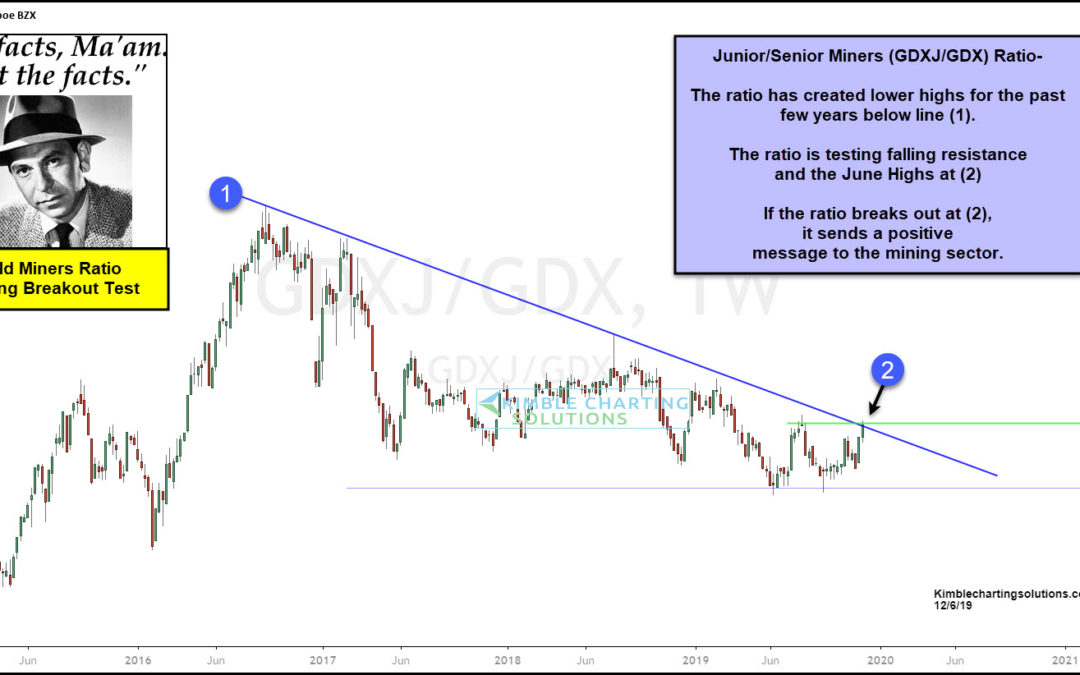
Are Gold Mining stocks about to be sent a bullish signal they haven’t received in years? Possible says Joe Friday. This chart looks at the Senior Miner/Junior miner (GDXJ/GDX) ratio over the past few years. Historically when the ratio is heading up, miners tend...
by Chris Kimble | Sep 30, 2019 | Kimble Charting
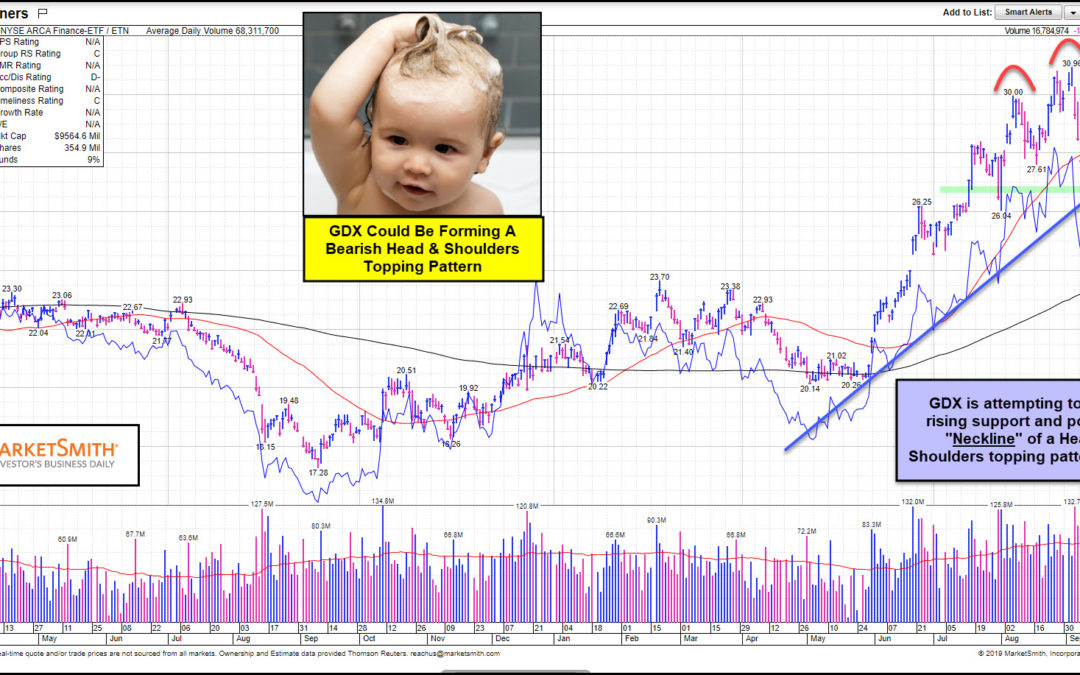
This chart of Senior Gold Miners (GDX) from Marketsmith.com reflects it could be forming a “Head & Shoulders” topping pattern over the past couple of months. This pattern could be about to send Gold Miners a rather bearish message. What would it take...
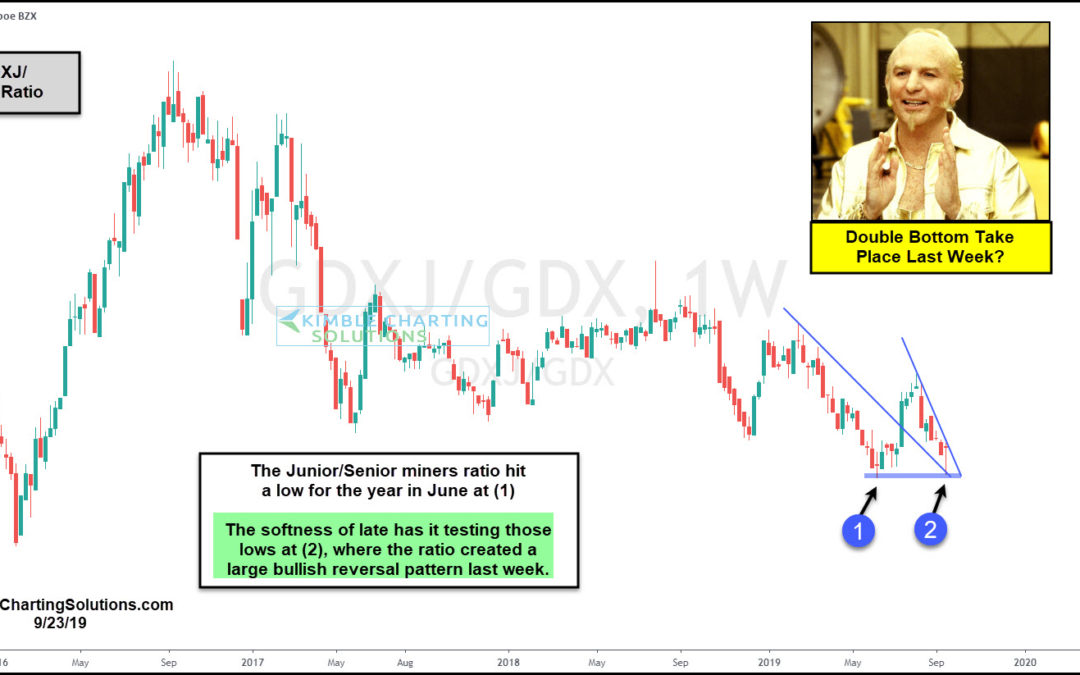
by Chris Kimble | Sep 23, 2019 | Kimble Charting
Gold Miner’s bulls have been wishing for the past couple of years, that the Junior Miners/Senior miners ratio (GDXJ/GDX) would rally. Did the ratio create an important low last week while testings its 2019 lows? Possible. The GDXJ/GDX ratio hit lows for the...
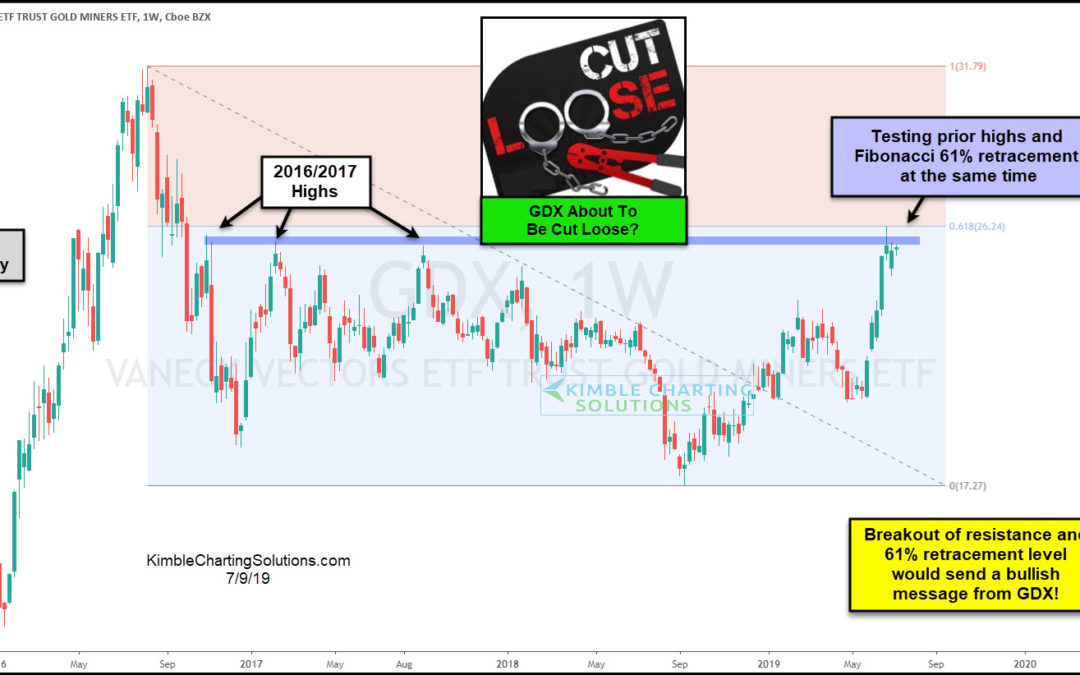
by Chris Kimble | Jul 9, 2019 | Kimble Charting
Are Gold Miners about to “Cut Loose” to the upside? A key breakout test is in play, that will go a long way in determining this important question. This chart looks at Gold Miners ETF (GDX) on a weekly basis the past few years. GDX peaked three different...
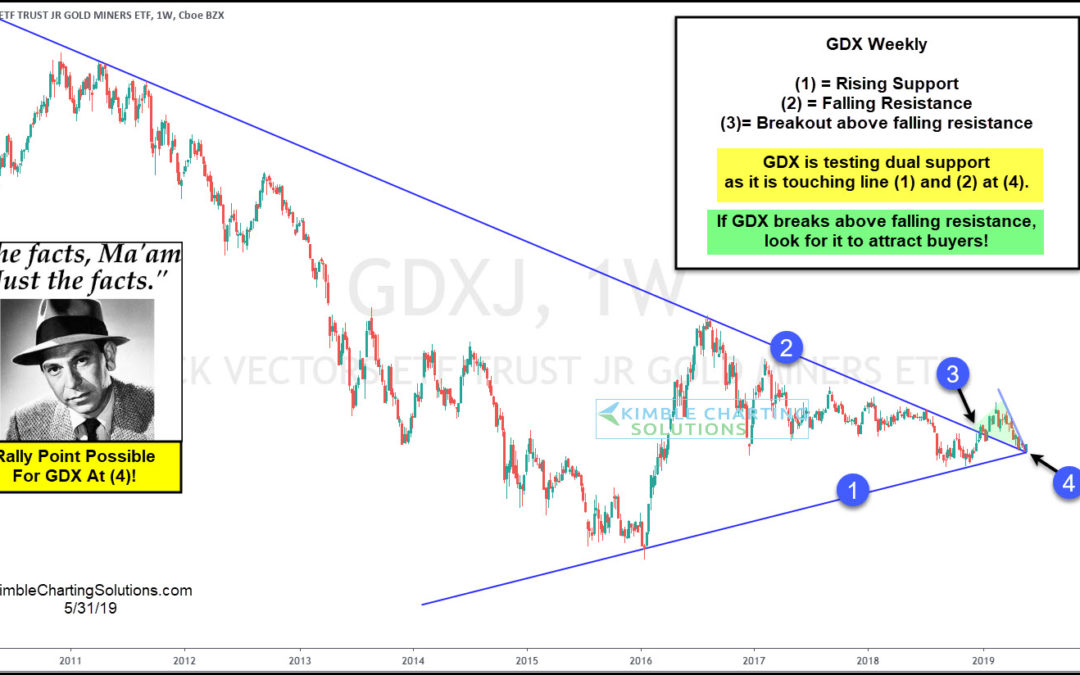
by Chris Kimble | May 31, 2019 | Kimble Charting
Gold Miners ETF (GDXJ) has declined nearly over 60% in the past 8-years. Is the bear market in GDX about to end? Let’s investigate why GDXJ is testing one of the most important price zones in years! GDX has created a series of higher lows along line (1) over the...
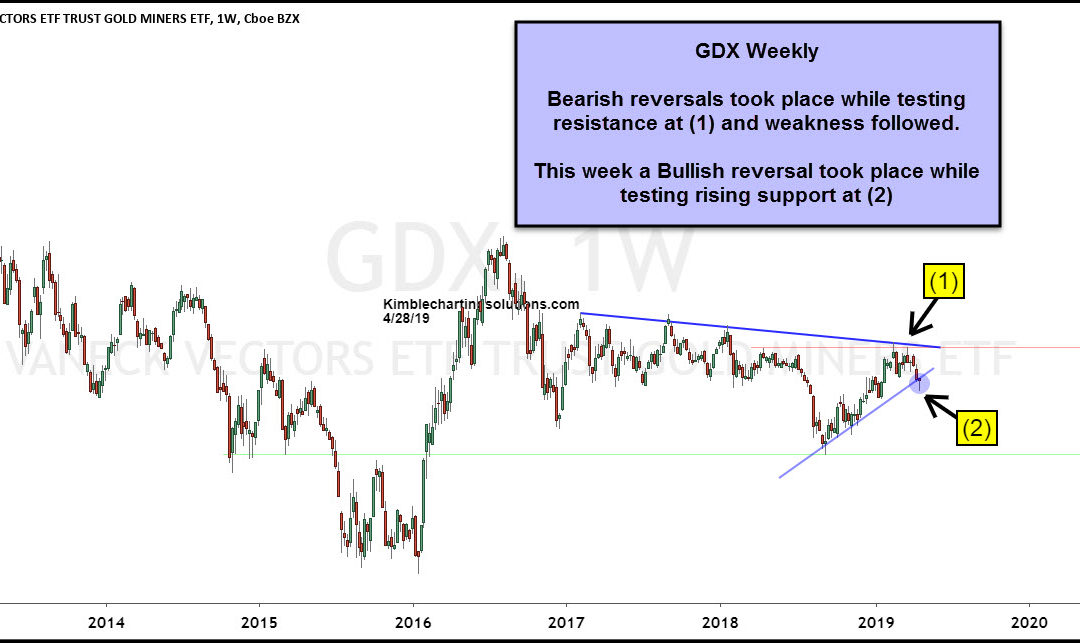
by Chris Kimble | Apr 28, 2019 | Kimble Charting
Two months ago Gold Miners ETF GDX created its first bearish reversal pattern (bearish wick) while testing falling resistance. A couple of weeks later it created another bearish reversal pattern (Bearish wick) and then selling pressure took over and GDX fell 10%...
