Today’s technology stocks make the world run. The tech sector and select large cap stocks have lead the broader bull market for nearly 14 years.
So when they are weak, investors should take note!
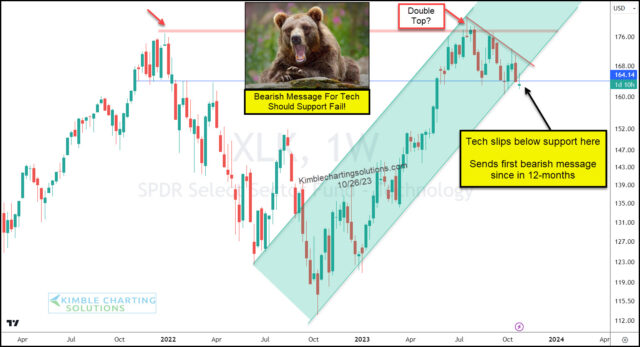
Today’s chart takes a “weekly” view of the S&P Technology Sector ETF (XLK).
As you can see, price hit resistance at last year’s highs, potentially forming a double top.
And now it appears that XLK is testing a very important lateral price support level.
Support is support until broken!!!
XLK has slightly breached that level and needs to rally back to retake it soon.
Should it break, this increases the odds that a double top is in play… with a deeper decline. Stay tuned!
This article was first written for See It Markets.com. To see the original post, CLICK HERE.


