Below looks at the Nikkei Index from Japan and the Shanghai Index from China. Let me make this point right off the bat-“Both” markets at this time are in rising trends.
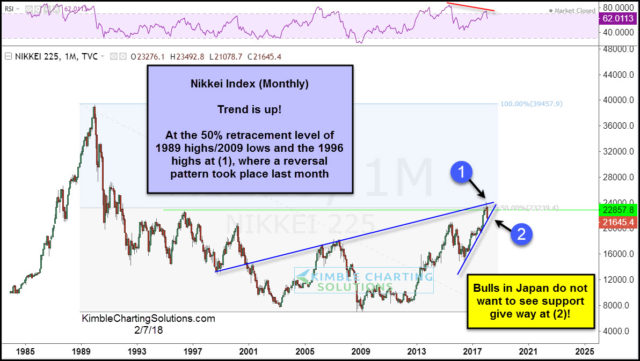
Below looks at the Nikkei Index on a monthly basis over the past 30-years-
CLICK ON CHART TO ENLARGE
As mentioned above the trend in the Nikkei is up at this time. The rally over the past few years has the Nikkei testing the 50% retracement level of its giant bear market that peaked in 1998 and bottomed in 2009. It is also testing the highs of 1996 at (1), as momentum is lofty and creating lower highs.
Bulls in Japan want/need to see rising support hold at (2). If it doesn’t, selling pressure could take place.
Below looks at the Shanghai Index (SSE)-
CLICK ON CHART TO ENLARGE
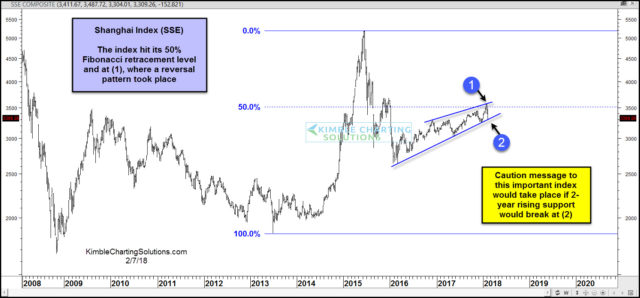
As mentioned above, the trend for the Shanghai index is up. The rally over the past couple of years has it testing the 50% Fibonacci retracement level at (1), where a reversal pattern took place recently. Rising support is in play at this time at (2) and bulls in China want/need support to hold at (2).
Bottom line– Both of these key indices are in rising trends and each hit a 50% Fibonacci retracement level of late where some selling pressure took place. Both are now testing important rising support lines that bulls in each country want/need to hold.
What do the bulls want to see here? Each break out above the 50% retracement levels!!!


