
It’s always good to monitor the performance of market-leading sectors and indices. These leaders provide insight into the health of the bull market, potential trend changes, and/or the trend status of that particular sector or index.
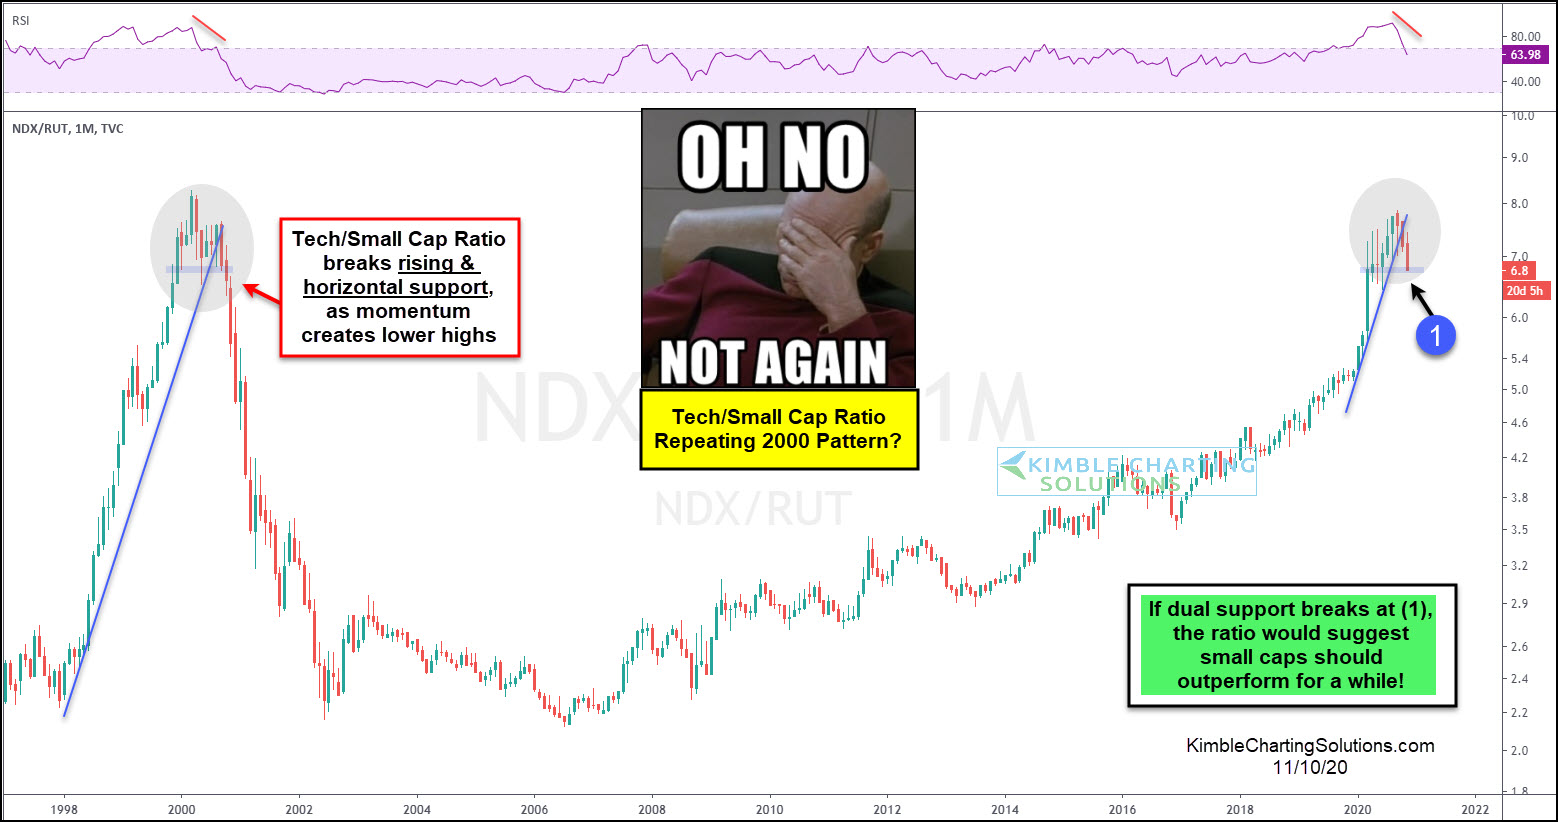
Today’s focus is on a long-term “monthly” chart, highlighting a current bull market leader – The Nasdaq 100 Index (representing large-cap technology stocks). And more specifically, today’s chart compares the performance of the Nasdaq 100 Index to the Russell 2000 Index (representing small-cap stocks).
This ratio clearly displays the importance of large-cap tech stocks to the current bull market. Wow, just look at the out-performance over the past 10+ years!!
BUT, all good things eventually come to an end… and if you have been around the block for a few decades, maybe you are experiencing a little deja vu.
Recently, the large-cap Tech to small caps ratio has turned lower (and momentum has turned down as well). This looks awfully familiar to what happened back in 2000. Similarly, the ratio broke its steep up-trend and is now testing a big horizontal support level at (1). Horizontal support broke in 2000, confirming the reversal lower… will it break again in 2020 or early 2021?
This article was first written for See It Markets.com. To see the original post CLICK HERE.
