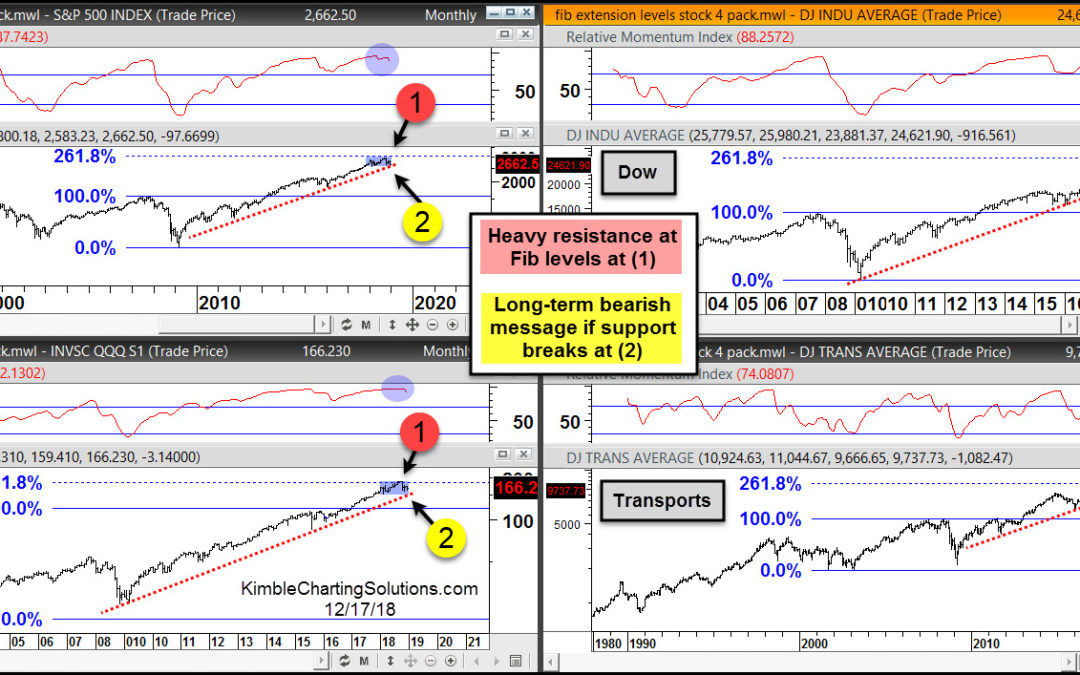
by Chris Kimble | Dec 17, 2018 | Kimble Charting
Even though stocks have been weak of late, breaks of certain price levels could actually trigger much more selling than stocks have seen so far. This 4-pack applies Fibonacci extension levels to the S&P 500, Dow, Nasdaq 100 and Transports. Each of these indices...
by Chris Kimble | Aug 23, 2018 | Kimble Charting
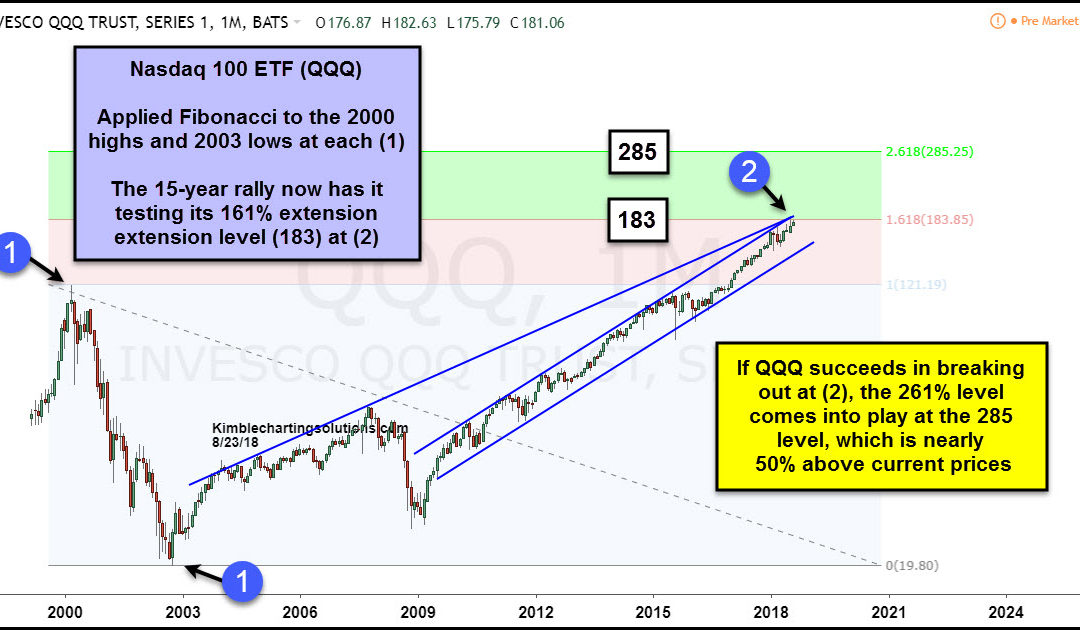
CLICK ON CHART TO ENLARGE This chart looks at the NDX100 ETF (QQQ) over the past 20-years on a monthly basis. Fibonacci was applied to the Dot.com highs in 2000 and the lows in 2003 at each (1). The rally over the past 15-years has QQQ testing it 161% extension level...
by Chris Kimble | Jun 15, 2018 | Kimble Charting
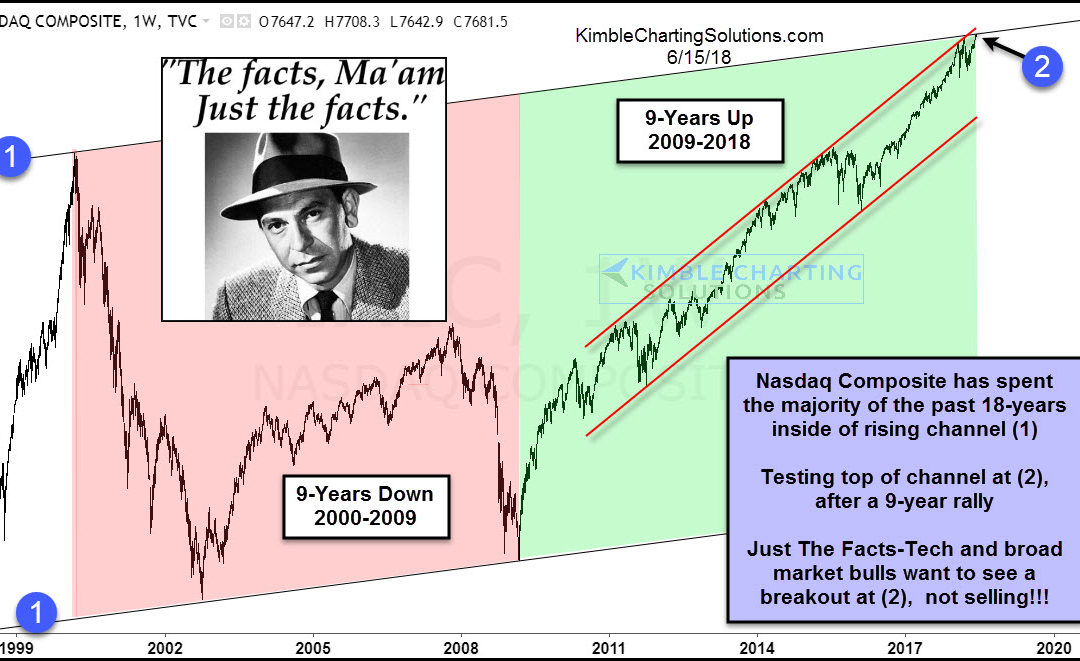
CLICK ON CHART TO ENLARGE This chart looks at the Nasdaq Composite index over the past 20-years, reflecting that the long-term trend is up and it has hit all-time highs of late. The index has spent the majority of the past 18-years inside of rising channel (1). It...
by Chris Kimble | Apr 20, 2018 | Kimble Charting
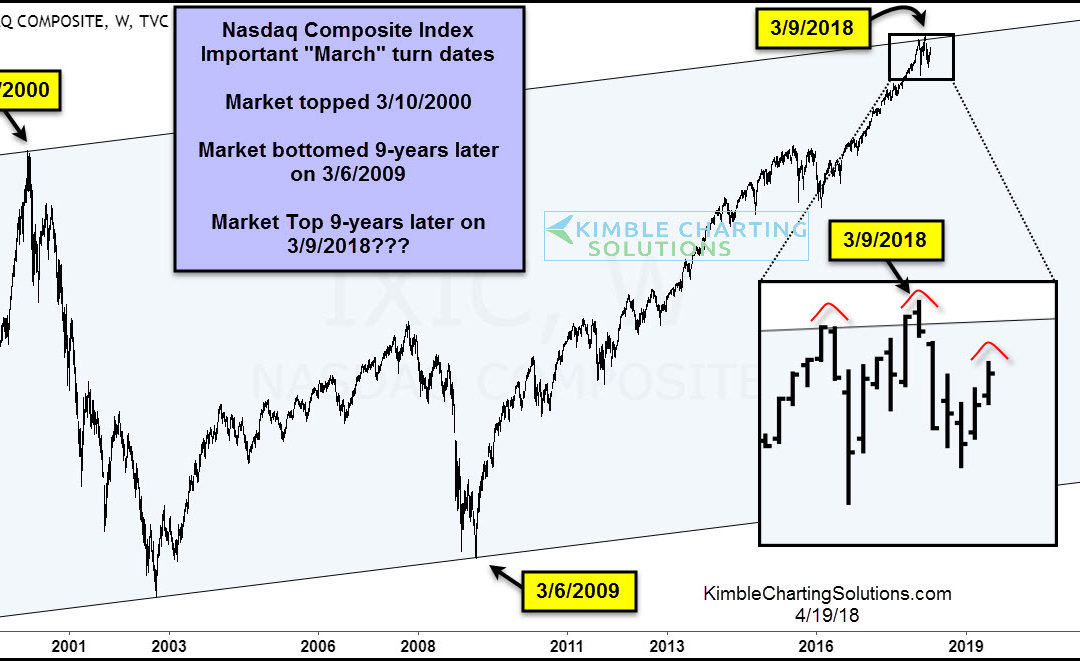
The month of March has produced some major turning points for the Nasdaq Composite over the last 20 years. The Nasdaq topped in March of 2000 and bottomed 9 years later in March 2009. Is it possible that 9 years after the major bottom, we put in a major top (March...
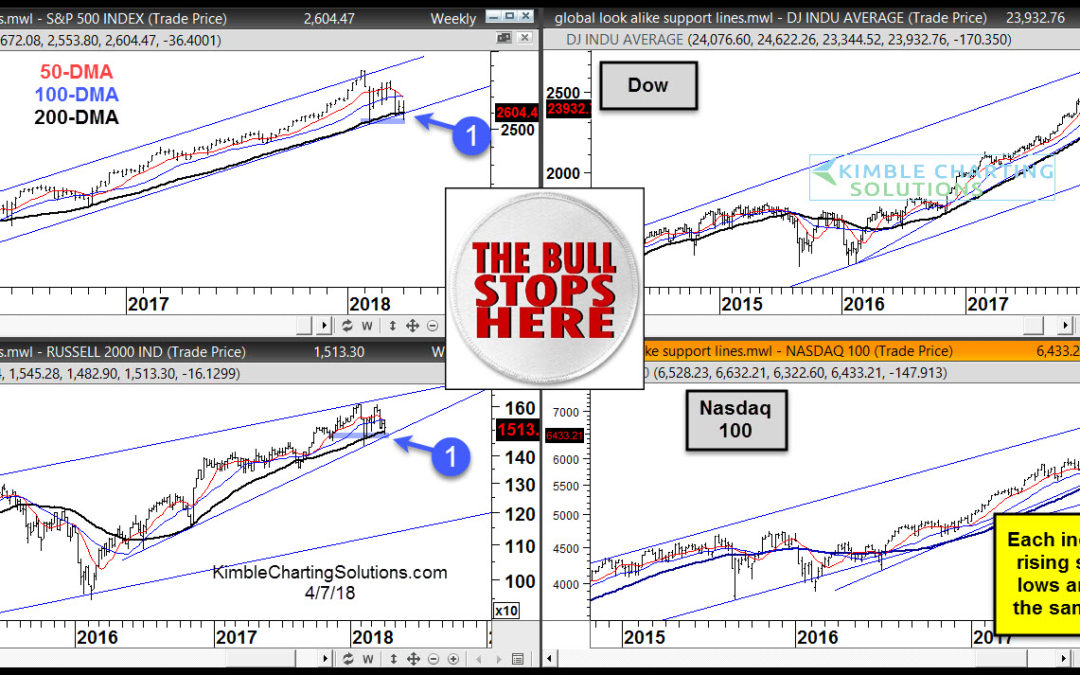
by Chris Kimble | Apr 7, 2018 | Kimble Charting
CLICK ON CHART TO ENLARGE The definition of a bull market or bull trends widely vary. One of the more common criteria for bull markets is determined by the asset being above or below its 200 day moving average. In my humble opinion, each index above remains in a bull...
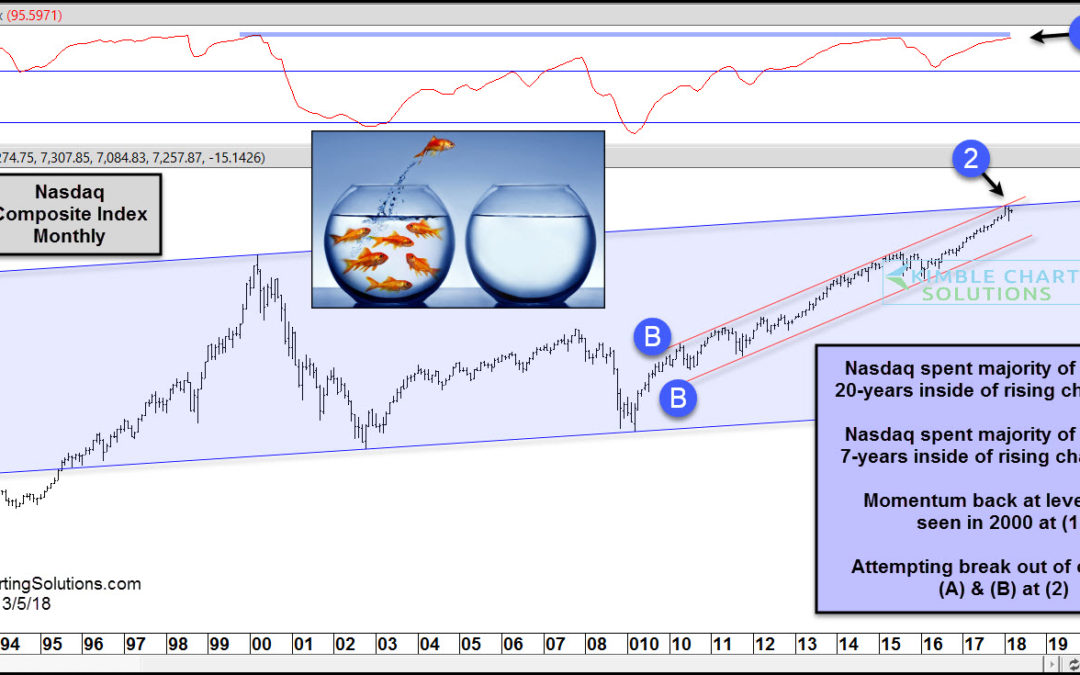
by Chris Kimble | Mar 5, 2018 | Kimble Charting
CLICK ON CHART TO ENLARGE The chart above looks at the Nasdaq Composite Index over the past 27-years, on a monthly basis. The trend remains solidly up for tech, no doubt about it! The index has spent the majority of the past 20-years inside of rising channel (A) and...
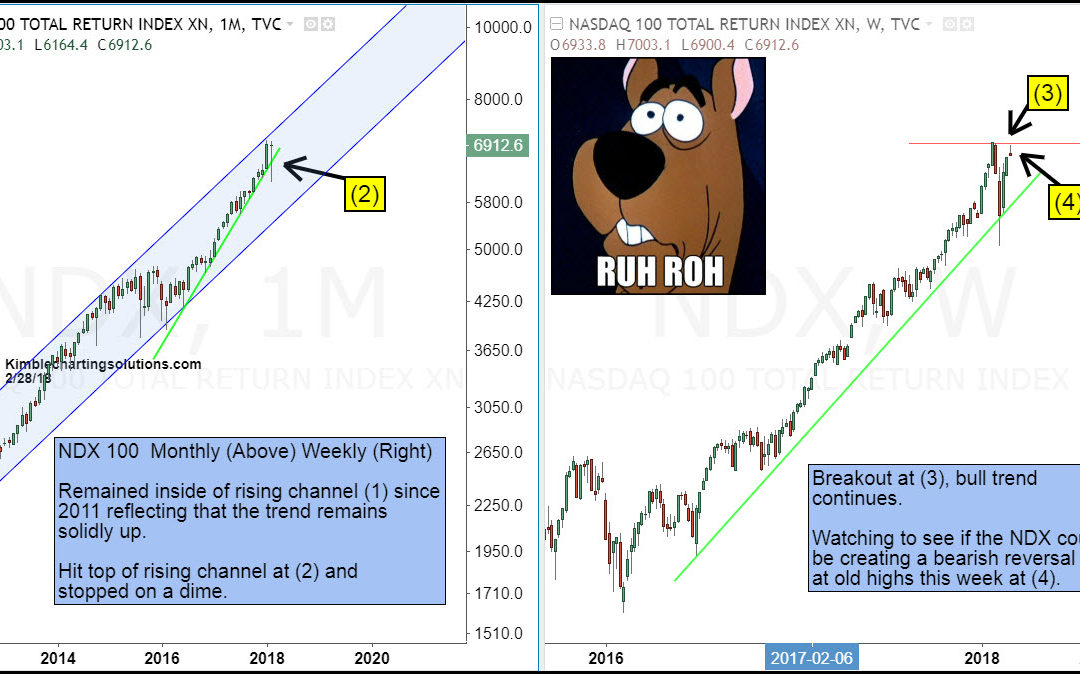
by Chris Kimble | Feb 28, 2018 | Kimble Charting
CLICK ON CHART TO ENLARGE Both charts above are the Nasdaq 100. Monthly on the left, weekly on the right. NDX hit the top of rising channel (1) in January and stopped on a dime. Soon after it declined 10%, then reversed higher after hitting rising support at...

by Chris Kimble | Dec 1, 2017 | Kimble Charting
First Fact….The Nasdaq tech train trend is up and has NOT derailed at this time, nor has it slowed down! Below looks at the Nasdaq Composite index over the past 20-years- CLICK ON CHART TO ENLARGE As mentioned above, the trend in the Tech remains higher and it...
