
CLICK ON CHART TO ENLARGE
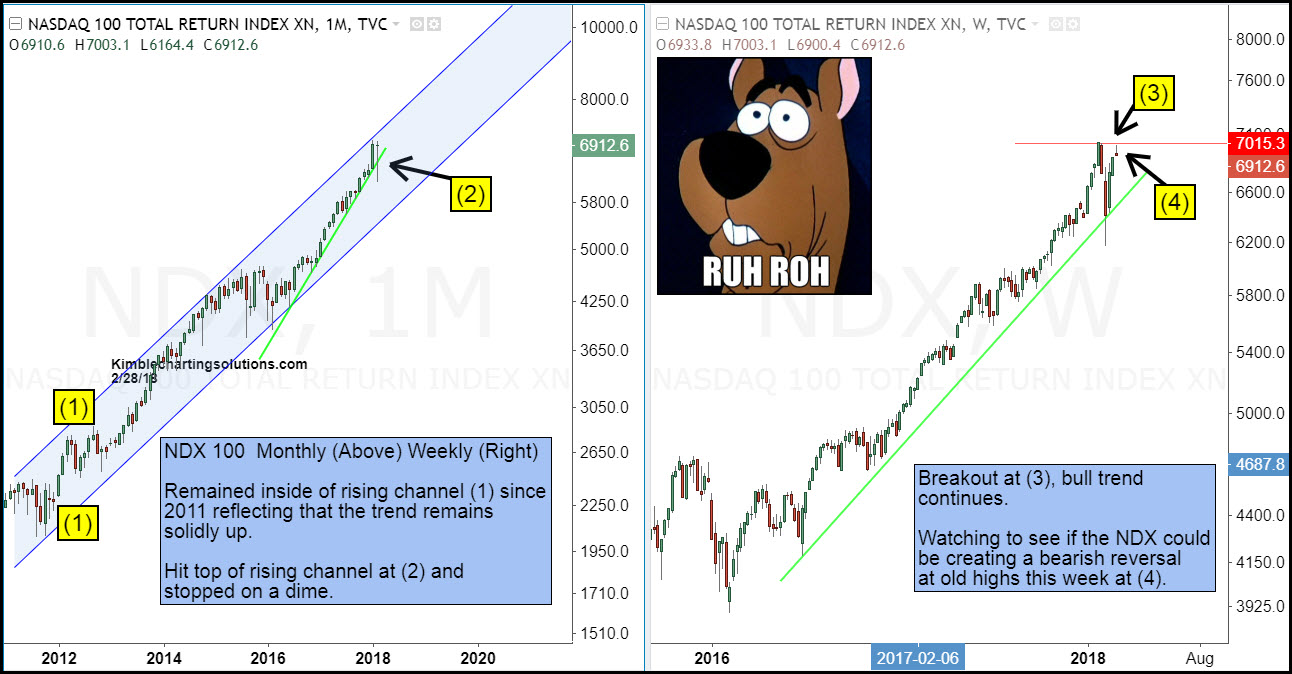
Both charts above are the Nasdaq 100. Monthly on the left, weekly on the right.
NDX hit the top of rising channel (1) in January and stopped on a dime. Soon after it declined 10%, then reversed higher after hitting rising support at (2), which has been in place for the past 2-years.
The weekly chart highlights that the NDX this week is back testing all-time highs at (3). With the trend being up, bulls would love a breakout of old highs.
The week is FAR from over. Potential that the NDX is creating a bearish reversal pattern at old highs this week. What the NDX does at weeks end, will be important for both the bull and bear case.s
For sure, bulls do not want to see a bearish reversal at old highs and then a break of 2-year rising support that held earlier this month.
View our most recent webinar multi-decade patterns in play and how to take advantage

