
 CLICK ON CHART TO ENLARGE
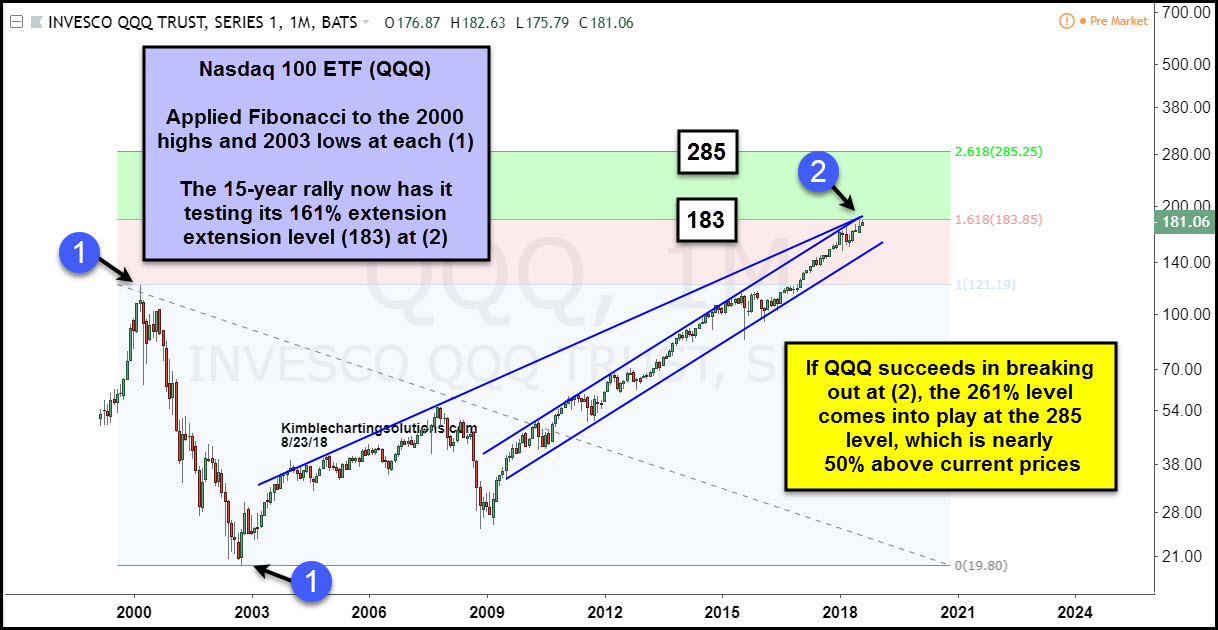
This chart looks at the NDX100 ETF (QQQ) over the past 20-years on a monthly basis. Fibonacci was applied to the Dot.com highs in 2000 and the lows in 2003 at each (1).
The rally over the past 15-years has QQQ testing it 161% extension level for the first time in history at (1). While it is testing the 161% level, it is also testing the top of an 8-year rising channel at (2).
We applied the next Fibonacci extension to QQQ, which is the 261% level. The 261% target comes into play around 285, currently 50% above current prices.
A very important breakout test is in play for Tech at (2), at the 183 level. If tech can find the strength to break out, bulls would get a positive message. What QQQ does at (2), will be important for the short and intermediate term trend!
–
