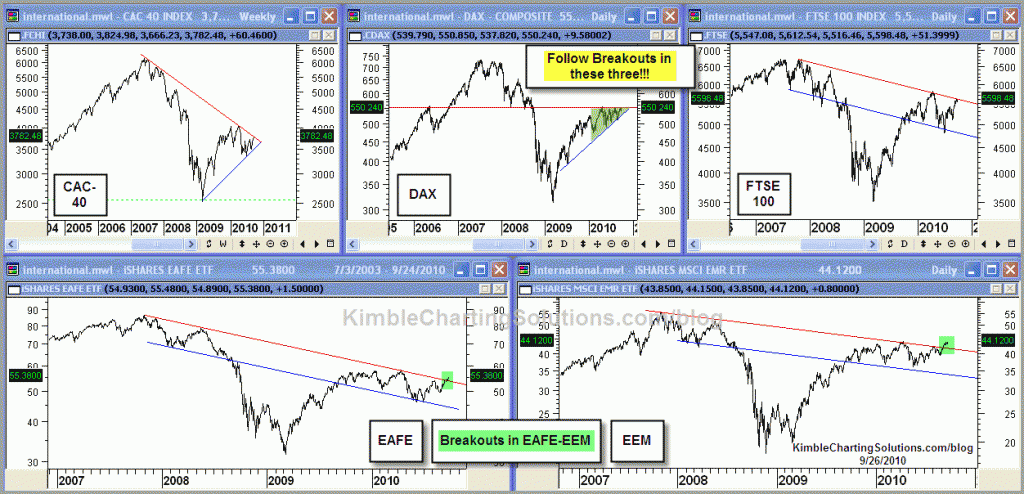
Last week I did a post titled “All the same trend” (see post) which reflected how the major indexes around the world are all acting the same. The charts below focuses on major international markets.
Went long EEM in the “Early Bird” posting (see post) due to an upside breakout. An upside breakout in these International markets should be purchased! After a purchase, use these resistance lines as new stops.


Chris,
Looking at the chart for the EFA (EAFE). There was a pretty significant price gap up on Friday from about 53.90 to 55.00 (I am looking at it on my phone so i cannot identify exact levels). Many times these gaps are backfilled in the near term before movement one way of the other. With the potential for this, how do you set your stop loss to avoid be stopped out before the ETF advances? Would it be better to first put in a limit order at 53.95, see if it fills, and then set up the stop loss (hoping the ETF does not go into a free fall in the meantime)? Or buy around current prices and set the stop loss just below 53.90? Or something else?
Craig,
Will take an ascending triangle over falling resistance.
I wanted to show that some breakouts of falling resistance are close at hand…to be prepared to jump on breakouts is what I am hoping to raise awareness of.
C
then is the FTSE 100 the least favorable because of falling resistance?
Yes on EWG…it made 4.85% last week, over double the 500 index.
What is the best ETF for tracking the DAX? Would you use iShares EWG?
hi!This was a really wonderful blog!
I come from china, I was luck to find your theme in bing
Also I obtain much in your Topics really thank your very much i will come every day
Ascending wedge for the DAX is the most favorable
whoops – yes stop loss at resistance.
Curious, of the three Euro indexes, which is the most likely to breakout based on the pattern?
Stop loss on EAFE (ticker EFA) should be set at resistance?