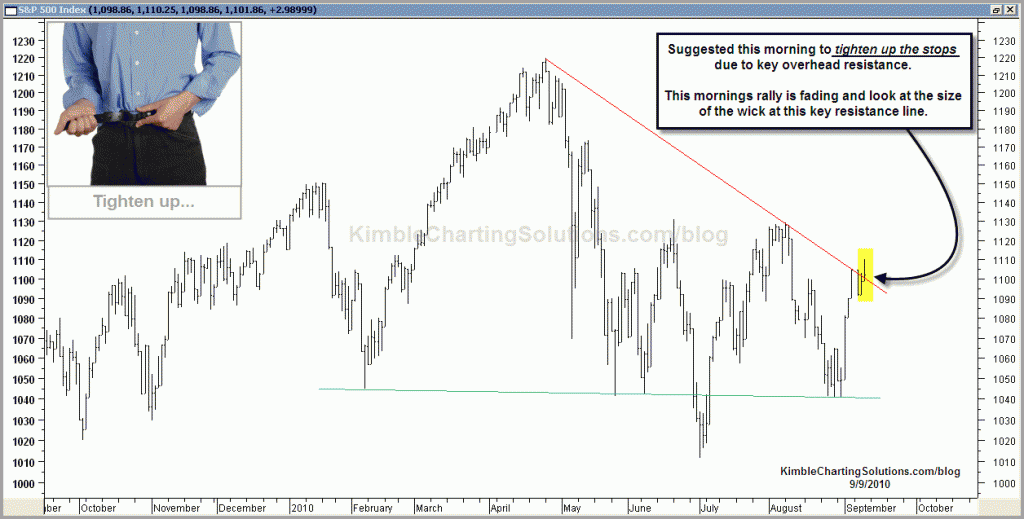
This morning I mentioned the 500 index was facing key resistance and to tighten up stops. See last line in the post below…. 500 index had a good rally earlier today, yet notice how it has faded (took a market snap shot at 12:30 central) and created a sizeable upside wick, which has a micro bearish meaning.
Will update any harvesting of gains or “Pocket Change” that should be picked up.


I believe in moving averages, have been a fan since the mid-1990’s. As you know, they are awesome at helping catch majority of uptrends and avoiding the majority of serious downtrends. I like to look at moving averages as “middle ground” strategies. MA’s challenges are turning points and sideways markets.
With this in mind the strategy I share on dshort and my blog is called TB&M, which stands for “Tops, Bottoms and NO Middles” the opposite of the Middle ground MA concept. I created it as a complement to moving average, because it works great, where MA’s struggle.
I look for low risk, high return patterns, that put the odds in our favor. This year is prime example, MA’s in this choppy enviroment have been very challenged and the numbers TB&M has put up I think speaks for why it helps to use part of a portfolio this way.
Chris
Chris, I’m wondering if you use other technical analysis tools such as moving averages and various oscillators, or whether you simply go by chart patterns.
For example, my own analysis shows that the S&P 500 is hitting resistance today at the 100-day Simple Moving Average, exactly where you show falling resistance. I’m far too green at this to have a whole lot of confidence in my chart work, so it’s encouraging to see my conclusions confirmed elsewhere, especially by somewhat different means, and especially by someone with a verifiably good track record.
Mike,
Thanks for the comments and questions.
Per the resistance comment…yes the 500 faced resistancetoday. I highlighted this line, due to wanting to protect gains. I didn’t say to sell, just protect.
With some of our positions up over 10% in the past week and month, I will do everything possible to protect the gains we have.
Per the DB bad news…I am not aware of it and don’t make decisions based upon news, I focus on patterns and price. The suggestions given on dshort and this blog are up well over 50% since the first of March. These gains came from believing in the “Power of the Pattern” not knowing what the news will be or how the markets when it is released.
On 8/29 I posted to Long stocks and short bonds. So far this has worked well for the readers. These suggestions came soley from pattern analysis. My goal is to “INFLATE” investors accounts regardless of market direction! I hope you can see this can be accomplished.
Thanks again for your viewership and these comments.
All the best,
Chris
Chris…I like your site and am very impressed with the accuracy of your comments and chart interpretations. I have a question though about the sources of technical signals. For example, this S&P chart show long-time resistance that the index is butting up against today. Yet, also today, Deutsche Bank announced that they were selling billions of assets to raise cash. As a technician, do you think that when ever there is resistance it is innate, so to speak, or is there some economic reason that is causing the technical question? Or to put it another way, was it coincidence that technical resistance was encountered on the same day bad economic news was released?