
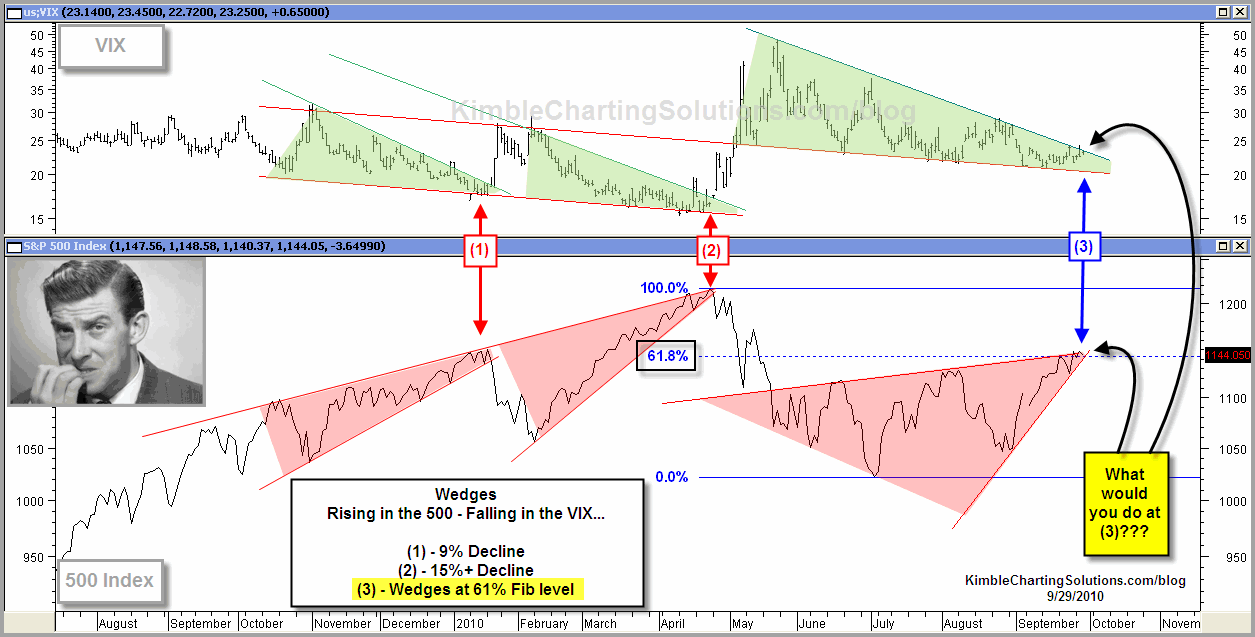
Going to do the quiz a little differently this week… You can see prices, dates and products…Just one simple question!

What would you do at (3)???
Now don’t let the fact that the 500 index has had the best September in 70 years, affect your decision! Overlook that the dollar has had one of its worst months in years!
Shoot me an email at [email protected] and let me know what you think investors should do.

Thank you for the helpful information! I would not have discovered this by myself!
I have wanted to post something like this on my site and this has given me an idea. Thank you.
I’m having a small problem I cannot subscribe your rss feed, I’m using google reader by the way.
Rob,
Good comment…sure discussed a ton.
I tend to think QE2 (at least the first part of it) is already in the market.
I’d anticipate an increase in the VIX and a drop in the S&P. I’d keep some tight stops on the S&P, though, in case news of QE2 causes the market to pop significantly. Many of the top Dow increases have been while the macro trend was downward. I would have to think QE2 is already priced in at current levels, but could be wrong. The market seems to look for any glimmer of hope, and my fear is that QE2 will be seen as hope.
William (Regis)
you can still “phone a friend” for ideas!
Dan,
Per Natural Gas, that was the quiz of two weeks ago. NG was on 16-year support.
Al,
great point per bringing up the euro/yen!
Simon,
wedges put the odds at 65%, yes! When situations/setup like this are present, people should be on the edges of their seats. The technical setup is here, now something is going to happen in the news and the talking heads will blame it on the news event, even though the alignment is all in place.
Thanks Chris for the chart. At (1) and (2) VIX made some zigzags before rally. I would watch USD index (come back to neckline ?) and VIX (break support) then shorting on SP.
Chris, Thank you for the great charts. The VIX and SP500 pattarns look repeatable. Learning form your web, the Euro/yen is one of the the leading indicator. If the VIX breaks out, I would verify the US dollar index and CRB index for confirmation. If all these data give signals, buy SDS and VXX.
Thanks again for the technical charts.
Chris you are GREAT! Thanks! Did you find time to give a look at Nat Gas?
Thank you very much for your great analysis.
Fear came back in the Vix at 2. The Vix has stayed elevated but is above a falling channel. Should the Vix drop back into the channel that would be a buy signal. Should the Vix wedge be a continuation pattern then it would be time to harvest or go short. I very much lean towards harvesting rather than going short. I do however think the chances of a reversal are high. What are the odds that the Vix wedge is a continuation pattern Chris? Is it %65?
just so we’re all practicing for our wives/girlfriends, if the market goes against us on a long position are we still blaming high frequency traders & Goldman Sachs?
I’m going to say to this posting we need to sell…final answer. No polling of the audience of 50/50 needed, Regis.
However, I think a lot of people are looking for a sell off to get long this market. If we think back really hard, doesn’t this look like the setup before last quarter’s earnings? Sell off and then whipsaw right back up.
And, how about that moratorim? Anyone else watching RIG, NE, or OIH?
Buy vxx-contra vix-if there is a breakout.
Short S&P if there is a reversal.
Should note that this is end of month & end of quarter plus Friday is new month so have to be aware of possible window dressing leading to a false breakout of the S&P
From what I’ve learned from you, Chris, I’ve got 8 ATM Puts and 4 ATM Calls on SPY – with tight stops and a hair trigger…