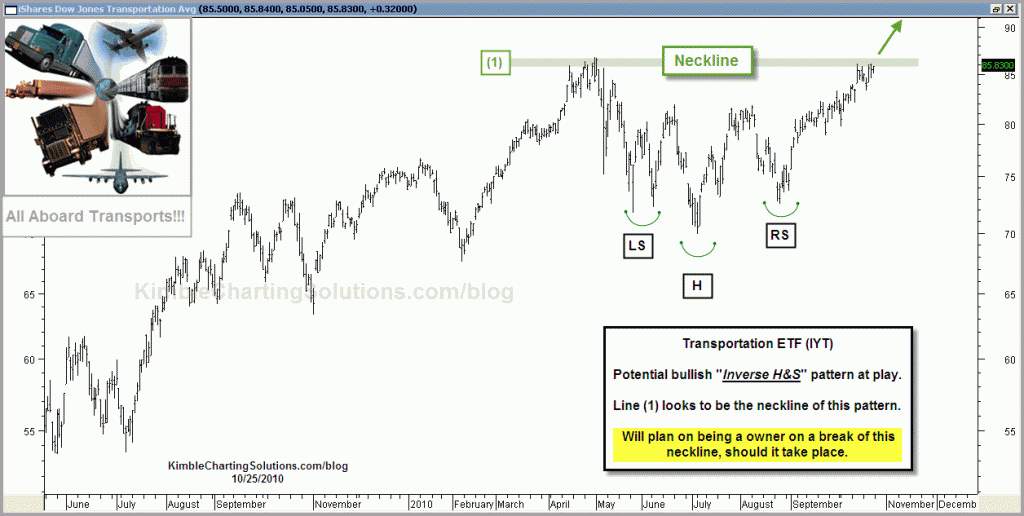
I highlighted bullish “ascending triangles” in the Trucking and Railroads post. (see post here) Another potential bullish pattern is taking shape in the Transportation ETF (IYT) below.
CLICK ON CHART TO ENLARGE
Game Plan… Potential “Inverse Head & Shoulders” pattern at hand (ascending triangle/cup and handle too). Neckline is the big key. I am watching IYT closely! Will plan on being a buyer with a stop, if the neckline is taken out to the upside. Bullish pattern if price can break the neckline!


George,
I am deeply honored and humbled by what you shared George. I totally love what I do, more so now, even though I have been doing this for 30-years!
I was so lucky that my hero/mentor Sir John Templeton shared with me in the late 1990’s that “at best this market would go sideways” for up to 20 years! Since it didn’t appear buy, hold & hope was the way to go, I bought metastock software in the late 90’s and went full bore into finding solutions for what he said would come our way.
I find it a real thrill to solve pattern puzzles and come up with solutions. So many talk about how bad things are and talk problems…I so desire to find “solutions” for people, that is why I named my company “Kimble Charting Solutions” instead of Kimble Charting “Problems!”
I so appreciate your and everyone’s viewership of the blog.
Thanks again for the kind words!
Chris
Chris,
Thank you! BTW, I have been a long time TA practitioner. You’ve done a great job looking at the data and calling it from there. I’ve noticed that a lot of the TA being done is actually thematic first and then data second with a constant reinterpretation of what “wave we are in.”
Your combination of great data, charts, humor, and insight make your site my favorite market site to read every day.
Thanks,
George
George,
Great comment and it does make sense.
This isn’t an ideal H&S in my opinion, kind of ragged, yet a possible one it seems to me.
As you can see I was drawing the line off the highs back in April, which looks like a key line in the sand for this ETF.
Almost looks more like a cup pattern, working on the handle…
Dow touched its April high, made a bigger bearish wick today than the April highs…pretty important formations going on right now it appears to me.
Thanks for the comment and viewership,
Chris
Chris,
Quick question: isnt the neckline here in the 81-82 range as opposed to 86-ish? I am just using the definition of the the neckline as where the shoulders start/terminate.
Thanks for the great work.
George
Waiting for it to break out. With so many other things that are ‘on-the-line’ right now, will wait for IYT to close above $87 for a couple of days before committing. BTW, it does look like it broke higher than the April highs.
Mike,
Since I draw lines with such a fine point on the charts you see, I prefer to give it crayon disatance of 1-2%.
My opinion, if we are right on a breakout, I am willing to give up a fraction, just to play a game of prove it.
I have always felt if I can see these lines, the people with Billions can too and since we are dealing with financial battle grounds, I don’t mind seeing some proof. I don’t know how, but I do feel prices are somehow controlled at these key levels!
Some people Mike go the other way around…they buy right below resistance, place a 2-4% stop and go with it.
Right now I deeply respect the overhead fib. resistance! We are getting a few upside wicks taking place of late at these key levels…has my attention
If someone would like to be long right here, I would make sure they have good exposure to the high yields mutual funds that I have bored people with and mentioned numerous times. That allows people to collect a dividend while the markets proves itself.
The high yields just keep moving higher…really hate to see that! just kidding of course…
Chris, excuse me for my question: may be you’ve answered many times or I misunderstood some answers.
I’ve asked many time to different people:
When can we consider a resistance or support broken?
If I wait to be sure it could be late; if I buy when it is broken, may be it can retrace and I’m sure to be mostly in the wrong side of the market…
Thank you. That’s to say for me it’s better to wait your signal.
ciao
Mike