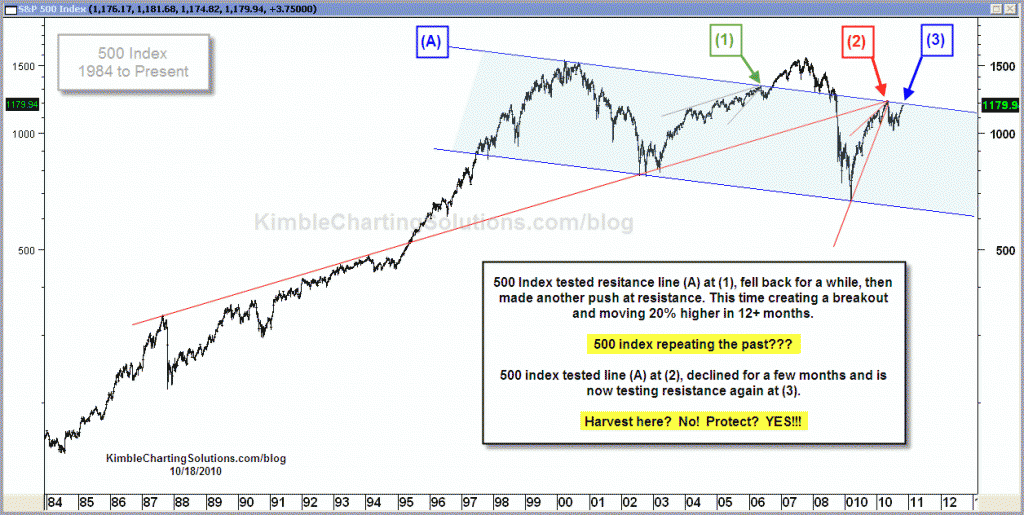
I received several requests to update the “be prepared” chart, discussed in the “Who is knocking on the door” post… here you go!
For new viewers I posted the chart below on 4/13 (see post here) reflecting that the 500 index was up against MULTIPLE/LONG-TERM resistance lines. Shared in the post it was a time to be like a “Boy Scout and BE PREPARED!” The high took place 10 days later, a little less than a 3% gain, before breaking support.
CLICK CHART TO ENLARGE
Below is the same chart, using the same channel lines, updated to reflect the current situation.
CLICK ON CHART TO ENLARGE
It took the 500 index a second attempt to break resistance at (1), back in 2005-06. Now at (3), the 500 index is making a second attempt at the same falling resistance line.
Different time time???? As I shared in the chart above. Harvest? NO! Protect? YES!!!


Chris – great looking charts. Is it possible to include the price levels your charts are indicating as “important breaks”? Thanks for all you are doing!
Hi Kimbler.
Please, its possible, make grafics with IBOVESPA – Brazil.
Here we have in rally.
Thanks for all.
Regards,
Storms – Brazil
Dow 30 is has almost identical pattern, so it seems.
If it does fail, it will setup a beautiful decade long head and shoulders.