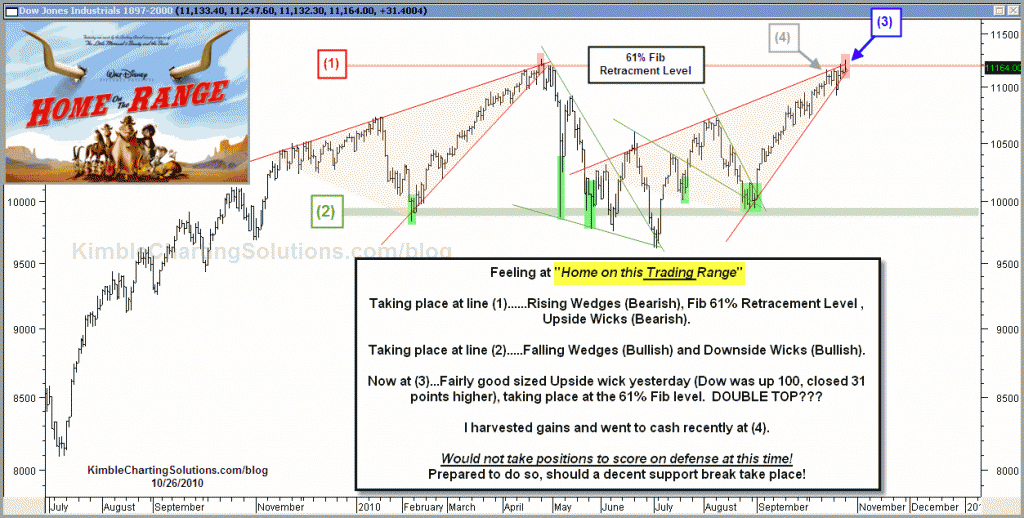
For almost a year, it has paid to “Trade the Range” in the Dow Jones Industrial Average. Plant seeds of growth at the bottom of the range and Harvest gains at the top. For aggressive investors, it has paid to take positions to score on defense at the top of the range as well. Update of the range below..
CLICK ON CHART TO ENLARGE
As I shared in the chart above…Harvested positions last week (see post here), due to reaching this critical resistance and the position of the Dollar, on potential support with very few bulls (see post here).
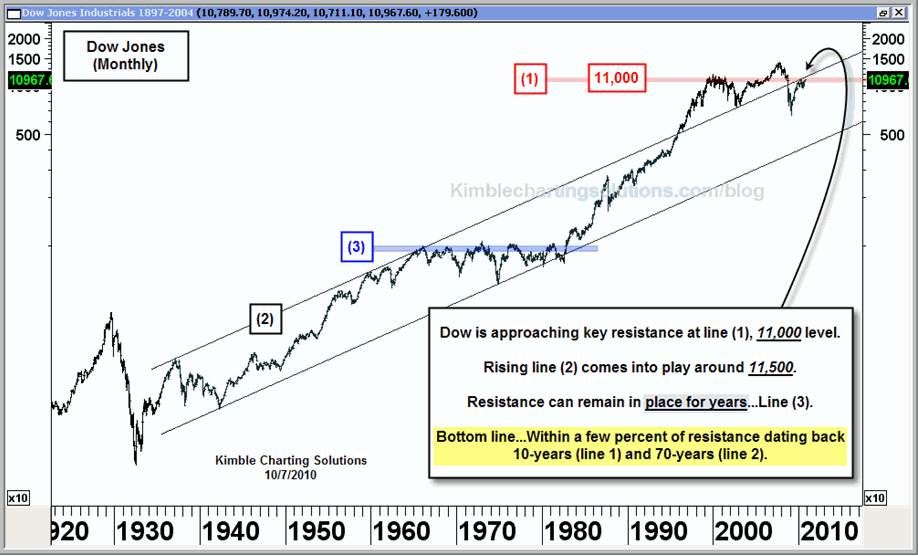
Not only is the Dow at the top of its year-long trading range, the Dow is facing 20 & 70-year resistance (see post here) in the chart below. Shared in the chart below that 11,000 to 11,500 should become stiff resistance. We are there currently.
CLICK ON CHART TO ENLARGE
I remain of the opinion that “even though the music is playing, we don’t have to dance to EVERY TUNE!” Translation… After harvesting, it is fine to set back and let other people play the market, until a breakout or breakdown takes place.
As I shared in the top chart, would not suggest to take positions to score on defense at this time! Am open to do so for sure….just too many positives taking place right now to take that risk.


That’s one thing that’s always seemed amazing to me: why wasn’t everyone buying 30-year Treasuries? With hindsight, it seems like the ultimate easy/no risk trade.
The one problem with trading the various patterns is that not many people are comfortable, or even able, to trade with that frequency. Your average Joe with $350,000 in a 401k has all sorts of restrictions on trading, and usually few choices. I think those people are just getting permanently fed up with equities.
Great points Bob!
Speaking of interesting…this is to me. I got into the Financial planning business in 1980, straight out of college. Dow hadn’t went anywhere for over a decade, gold was at all time highs, at that time.
Now stocks have went flat for 10 years, gold is at all time highs, again! Sound almost the same??? small difference though…Rates on t-bills were 18% then and almost 0% now!!!
S.W.A.N……know what that stands for? “Sleep Well At Night!” I “sleep well at night” due to the use of the “power of the pattern.” If I didn’t have these tools, S.W.A.N. would not be part of my life for sure!
During the period of the 1968-82 bear market, the DJIA appears flat, but it’s important to remember that was a period of high inflation. The assets of these businesses increased by almost 400%, the Q ratio went from above 1 to .38. So in 1982 you paid the same for the DJIA, but it had almost three times the value.
This time, it’s almost the opposite. The market is down 20%, but net assets are also down and the Q value now is about the same as in 2007.
Either there is a new valuation regime in place, or the market is defying gravity.
We live in interesting times…
Deep South..
Could it be a right shoulder? Yes.
The odd part of this pattern if true, is the right shoulder is so close to the head. Usually the Right and Left shoulder are about the same distance from the head.
I am not saying it isn’t possible, just sharing it isn’t ideal.
If this is a H&S pattern, testing the mid-range of the 70-year channel would come into play!
Chris on that 80 year Dow chart – Might that be a big head and shoulder top with the right shoulder being formed at this time? If so, there might be a big downside to it.